The Safest and Most Dangerous Cities in Utah
 |
November 11, 2026
Utah Security Solutions
The following is a list of cities that provide home security solutions in the state of Utah
Utah’s crime picture has two sides. Both its violent and property crime rates fall below national levels, but reported rape is a clear exception: at 63.7 offenses per 100,000 residents, it runs 76% above the national rate, according to 2025 FBI data. The trend since 2022 is also split. Violent crimes rose 2%, while property crimes fell 22%.
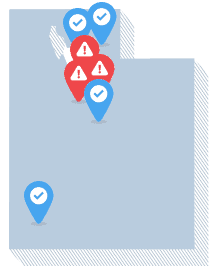
The differences between communities are just as wide, from very low rates in Smithfield and Lone Peak to far higher figures in the capital, Salt Lake City.
Statewide, Utah’s violent crime rate is 235.7 offenses per 100,000 residents, 28% below the national rate, and its property crime rate of 1,415.5 is 8% below the national benchmark. That puts the state 17th-lowest for violent crime and 23rd-lowest for property crime among the 50 states.
Utah Cities With the Highest and Lowest Crime Rates
The following tables compare places with populations of at least 10,000. All rates represent reported offenses per 100,000 residents in 2025.
Cities with the highest property crime rates
| City or jurisdiction | Property crime rate |
|---|---|
| Salt Lake City | 4,735.4 |
| South Salt Lake | 4,271.1 |
| Murray | 2,778.3 |
Cities with the highest violent crime rates
| City or jurisdiction | Violent crime rate |
|---|---|
| Salt Lake City | 857.4 |
| South Salt Lake | 708.7 |
| Ogden | 446.1 |
Cities with the lowest property crime rates
| City or jurisdiction | Property crime rate |
|---|---|
| Smithfield | 110.6 |
| Lone Peak | 111.7 |
| Santaquin/Genola | 177.4 |
Cities with the lowest violent crime rates
| City or jurisdiction | Violent crime rate |
|---|---|
| Kaysville | 27.0 |
| Lone Peak | 31.0 |
| Smithfield | 39.0 |
Source: 2025 FBI Crime in the United States, Table 8. Rankings include places with at least 10,000 residents.
Kaysville has the lowest violent crime rate among the 53 Utah cities we analyzed, with just 9 violent crimes reported in 2025, for a population-adjusted rate of 27.0 offenses per 100,000 residents. Lone Peak, located near a wilderness area and mountain peak of the same name, had 31.0 violent offenses per 100,000. Smithfield, at 39.0, ranked third for low violent crime rates.
Smithfield, known as “Utah’s Health City,” also has the lowest property crime rate at 110.6, followed closely by Lone Peak at 111.7. Santaquin/Genola at 177.4 completes the group. Smithfield reported 17 property crimes and six violent crimes, placing it among the lowest-rate communities in both categories.
Salt Lake City, the state capital and largest city, has the highest violent and property crime rates among qualifying places, at 857.4 and 4,735.4 per 100,000 people, respectively. Nearby South Salt Lake follows the capital city in both categories, with 708.7 violent crimes and 4,271.1 property crimes per 100,000 residents.
Salt Lake City’s 2025 public safety concerns included the fatal shooting of Arthur Folasa Ah Loo at the June 14 No Kings rally. The killing occurred during a lawful assembly, which added to the shock the community experienced. However, when weighing a move to the city, movers should consider recent incidents at home, work, and in public spaces, without treating one high-profile case as evidence of a citywide trend.
Ogden has the third-highest violent crime rate at 446.1, while Murray has the third-highest property crime rate at 2,778.3. Every city in these two high-rate groups exceeds the corresponding national benchmark.
How Does Crime in Utah Compare to Other States?
Utah’s property crime rate is modestly below the national benchmark. Motor vehicle theft is 44% lower and burglary 30% lower. A total of 50,092 property crimes were reported to the FBI in 2025 down from 64,069 in 2022. Larceny-theft is the exception, at 2% above the national figure. This is the most common property offense in the state.
Property crime rates
Offenses per 100,000 residents, 2025
| Crime type | Utah | National |
|---|---|---|
| Property crime overall | 1,415.5 | 1,534.8 |
| Burglary | 134.7 | 193.6 |
| Larceny-theft | 1,170.2 | 1,144.1 |
| Motor vehicle theft | 110.5 | 197.0 |
Utah’s violent crime rate is also less than the national rate. Robbery is 50% lower in Utah than in the U.S. as a whole, aggravated assault 39% lower, and murder and nonnegligent manslaughter 37% lower. However, the reported rape rate of 63.7 offenses per 100,000 residents is 76% above the national rate of 36.1. Overall violent crime counts rose from 8,175 in 2022 to 8,340 in 2025.
Violent crime rates
Offenses per 100,000 residents, 2025
| Crime type | Utah | National |
|---|---|---|
| Violent crime overall | 235.7 | 327.6 |
| Murder and nonnegligent manslaughter | 2.6 | 4.1 |
| Aggravated assault | 144.5 | 238.0 |
| Robbery | 24.9 | 49.4 |
| Rape | 63.7 | 36.1 |
Is Utah a Safe Place to Live?
Is Utah a safe place to live? For the most part, yes. Both violent and property crime rates are below national levels, and property crime has dropped sharply since 2022. Smithfield and Lone Peak stand out for low rates in both crime categories. But the picture isn’t uniform. Reported rape is well above the national rate, violent crime counts have crept up, and Salt Lake City and South Salt Lake have much higher rates than the state as a whole. If you’re considering a move, look at recent incidents in the specific neighborhood, because those details will tell you more than any statewide figure.
Where Our Crime Data Comes From
Unless specified otherwise, the information in this article is based on the FBI’s Crime in the United States tables. Statewide offense counts and published crime rates come from Table 5, national benchmarks come from Table 1, and city-level figures come from Table 8.
The state and national rate comparisons use 2025 data. Changes in Utah’s violent and property crime counts compare 2022 with 2025. The trend percentages reflect changes in offense counts, rather than population-adjusted rates.
For the local rankings, we calculated violent and property crime rates per 100,000 residents using the populations and offense counts in the 2025 dataset. Only places with at least 10,000 residents were eligible. We included zero reported rates and all places tied at the cutoff for the three lowest-rate selections. Missing values were not treated as zero. State rankings compare the 50 states and exclude the District of Columbia.
Percentages are rounded to whole numbers, and crime rates are rounded to one decimal place. Calculations and rankings use unrounded values. Rankings describe the jurisdictions included in the dataset rather than every community in the state.
Important note: Crime statistics offer valuable insights, but they aren’t the only way to evaluate a community’s safety. Local context, law enforcement participation, reporting practices, population estimates, and geographic boundaries can influence the figures. A zero reported rate does not guarantee that no crime occurred. These comparisons do not establish why crime is higher or lower in a particular place.