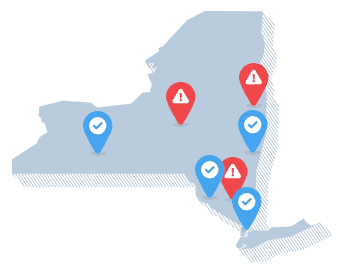
The Safest and Most Dangerous Cities in New York State
 |
August 18, 2025
|
August 18, 2025
New York Security Solutions
The following is a list of cities that provide home security solutions in the state of New York
For many years, New York was associated with images of seedy 1980s Manhattan; muggings were commonplace, buildings routinely burned down and women didn’t walk alone after dark. You may already know the New York City of today looks a lot different than its crime-ridden past, but what about the rest of the Empire State?
New York state is so much more than Times Square and Lady Liberty, with communities as diverse as they are expansive. The state’s vibrant character stretches from Niagara Falls to the Hudson River Valley, encompassing Bills, Giants and Jets territory and boasting culinary classics like Buffalo wings and the $1 pizza slice.
In terms of crime, New York is solidly middle-of-the-pack. It ranks #20 in the nation for violent crime and #23 for property crime, but there’s a lot more to unpack with regard to how safe New York is. We’ll explore every corner of the state and delve into the numbers to find out which towns are the most and least dangerous.
New York cities with the highest and lowest crime rates
(per 100,000 people)
| Cities with the highest property crime rates | |
|---|---|
| Oriskany Village | 156,322 |
| Herkimer Village | 7,788 |
| Oneida | 6,167 |
| Cities with the highest violent crime rates | |
|---|---|
| Herkimer Village | 1,177 |
| Newburgh | 1,079 |
| Albany | 989 |
| Cities with the lowest property crime rates | |
|---|---|
| Lewisboro Town | 8 |
| Coxsackie Village | 36 |
| Windham Town | 57 |
| Cities with the lowest violent crime rates | |
|---|---|
| Shawangunk Town | 8 |
| Montgomery Town | 11 |
| New Castle Town | 11 |
Note: Excluding cities with crime rates of zero. Source: 2023 FBI Data
Cities in New York With the Lowest Crime
The New York town with the lowest violent crime rate is also one of the state’s most beautiful. Shawangunk Town is home to a number of natural features, including the Shawangunk Kill (“kill” is a Dutch word meaning “stream”), the Wallkill River and Minnewaska State Park Preserve. The Shawangunk Mountains, known affectionately as “The Gunks” to locals, tower 2,000 feet above the town. Here, the violent crime rate is a mere eight per 100,000 people, which amounts to a single aggravated assault in 2023.
Two Hudson Valley towns, Montgomery and New Castle, fall just behind Shawangunk for low violent crime. Montgomery had just one aggravated assault in the most recent year of reporting while New Castle had two.
Everyone is familiar with New York City, but it’s less likely that you’ve heard of its little neighbor to the north, Lewisboro. Located just outside of the Bronx in Westchester County, this 11,000-person suburb has the state’s lowest property crime rate at eight incidents per 100,000 people. Statistically speaking, that means there’s almost zero chance of being the victim of property crime there.
Heading a little further upstate will take you to two other locales with very low property crime: Coxsackie along the Hudson River and Windham in the Catskill Mountains. In 2023, these small towns had one theft and one burglary, respectively.
Cities in New York With the Highest Crime
With just 7,300 residents, the upstate New York town of Herkimer isn’t a very populous place, but it’s one of the most dangerous. It ranks in the state’s top three for both violent crime and property crime. For violent crime, it’s number one, with a per-capita rate of 1,777 violent incidents per 100,000 people.
Much of the area’s high crime rate can be attributed to its poor economic profile. The unemployment rate in Herkimer is 6.2%, which is more than double the national average for the same time frame.1 Its median income is 27% lower than the national level, and one in five people lives in poverty.2 Areas with a high poverty rate are more susceptible to crime, such as theft and burglary, as well as drug activity and gang-related violence.
New York’s second most dangerous city is Newburgh, which has long been associated with gangs, violence and tough economic conditions.3 Its per-capita murder rate is 14 per 100,000 residents; for comparison, New York City’s rate is 4. Newburgh’s story is complex. It’s a place with a deep sense of community, where locals who’ve spent their lives there say they don’t feel unsafe. A new influx of economic development, combined with community restoration efforts, has made meaningful strides to improve the area in recent years.4
When it comes to property crime, the tiny town of Oriskany leads the state with 156,322 incidents per capita. In real numbers, that means the town experienced more than 2,000 property crimes in 2023. It’s important to point out that in a town as small as Oriskany, crime rates can swing significantly from one year to the next. Getting the full context matters, too; it’s noteworthy that, in 2023, the town didn’t see a single report of violent crime.
Is New York City a Safe Place to Live?
Interestingly, New York City isn’t at the top or bottom of the list of the safest cities in New York. However, when you compare it to other very large cities, it’s about as safe as you can get for a major metro area in the United States.
Just for fun (and since New Yorkers are notorious for their hometown pride), let’s see how its crime rates stack up against the next biggest cities in the country, Los Angeles and Chicago.
New York City
- Violent crime: 668 per 100,000
- Property crime: 2,398 per 100,000
Los Angeles
- Violent crime: 820 per 100,000
- Property crime: 2,846 per 100,000
Chicago
- Violent crime: 606 per 100,000
- Property crime: 3,432 per 100,000
As you can see, New York City is comparable to or safer than its American big-city counterparts. It’s generally considered one of the safest large cities in the world.
How Does Crime in New York Compare to Other States?
As we mentioned earlier, New York falls in the middle when you compare its crime profile to the other 49 states. There’s mixed news in both the property and violent crime numbers; in some aspects, New York is safer, while in others it’s less safe.
Property crime rates (per 100,000 residents)
| Category | New York | National |
|---|---|---|
| Burglary | 152.8 | 250.7 |
| Larceny | 1463.7 | 1343.9 |
| Vehicle theft | 182.1 | 317.2 |
First, let’s look at property crime. You’re a lot less likely to have your house burglarized or your car stolen in New York than in other parts of the country. Its burglary rate is 39% below the national average, while its vehicle theft rate is 43% lower. However, theft in general is more common, with a rate about 9% higher than the U.S. as a whole.
Violent crime rates (per 100,000 residents)
| Category | New York | National |
|---|---|---|
| Murder/Non-negligent homicide | 3.0 | 5.7 |
| Aggravated assault | 256.6 | 263.7 |
| Robbery | 105.1 | 65.4 |
| Rape | 25.0 | 38.0 |
Next, let’s explore violent crime. It’s a mixed bag in this category too. Murder and rape happen a lot less frequently than in other places, with a murder rate 47% below the nation’s average and a 34% lower rate of rape. Robbery, however, occurs 58% more in New York than in the country overall.
At this point, you might be wondering about the distinction between robbery, burglary and theft, since they sound similar but the rates vary so much. Robbery involves taking a person’s property by force or threat, such as pulling a weapon, which is why it falls under the umbrella of violent crime. Burglary and theft, on the other hand, are crimes involving property rather than people. Burglary is the unlawful entry of a structure, while theft is the unlawful removal of property.
Both violent crime and property crime have fluctuated in New York; violent crime dropped 9% year over year, while property crime increased by 4.5%.
Is New York a Safe State to Live In?
Like every state, New York has some towns where you’re more likely to be a victim of crime. However, despite being home to the city that never sleeps, the majority of New York state snoozes safe and sound at night since it’s generally a safe place to call home.
Navigate Crime Data by State
- Alabama
- Alaska
- Arizona
- Arkansas
- California
- Colorado
- Connecticut
- Delaware
- Florida
- Georgia
- Hawaii
- Idaho
- Illinois
- Indiana
- Iowa
- Kansas
- Kentucky
- Louisiana
- Maine
- Maryland
- Massachusetts
- Michigan
- Minnesota
- Mississippi
- Missouri
- Montana
- Nebraska
- Nevada
- New Hampshire
- New Jersey
- New Mexico
- North Carolina
- North Dakota
- Ohio
- Oklahoma
- Oregon
- Pennsylvania
- Rhode Island
- South Carolina
- South Dakota
- Tennessee
- Texas
- Utah
- Vermont
- Virginia
- Washington
- West Virginia
- Wisconsin
- Wyoming
Where Our Crime Data Comes From
Unless specified otherwise, the information in this article is based on crime data compiled by the FBI and made available through the Crime Data Explorer. Statewide violent and property crime statistics are drawn from the FBI’s 2023 Crime in the United States Report (Table 5) and, for city-level crime rates, we referred to Table 8, which lists reported offenses by state and city.
Important note: Crime statistics offer valuable insights, but they aren’t the only way to evaluate a community’s safety. Local context, law enforcement practices and reporting standards can all influence how crime is recorded. Additionally, FBI publication tables and the data displayed on the Crime Data Explorer may differ slightly due to variations in methodology.
Citations
- U.S. Census Bureau. (2024). American Community Survey: Selected Economic Characteristics.
https://data.census.gov/table?q=DP03&g=160XX00US3634121 - U.S. Census Bureau. (2024). QuickFacts: Herkimer village, New York.
https://www.census.gov/quickfacts/fact/table/herkimervillagenewyork/PST045224 - The New York Times. (2010, May 11). Newburgh, Where Gang Violence Reigns.
https://www.nytimes.com/2010/05/12/nyregion/12newburgh.html?pagewanted=all&_r=0 - The U.S. Sun. (2023, Sept 2). US state's ‘most dangerous' city's transformation from violent crime to success.
https://www.the-sun.com/news/8966873/newburgh-most-dangerous-city-booming-local-business/