The Safest and Most Dangerous Cities in Iowa
 |
November 9, 2026
Iowa Security Solutions
The following is a list of cities that provide home security solutions in the state of Iowa
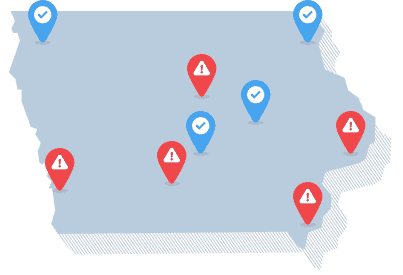
Iowa’s violent and property crime rates are both below national benchmarks according to the latest available data from the FBI. Norwalk in particular stands out for low rates in both violent and property crime, while Davenport appears among the higher-rate cities. In Davenport, police have taken a very targeted approach to reducing violent crime. They have leveraged the Group Violence Intervention method in which anti-violence messaging is shared directly with the highest-risk communities and individuals. Between 2022 and 2025, violent crime decreased 17%, while property crime decreased 11%.
Overall, Iowa has a violent crime rate of 233.9 offenses per 100,000 residents, 29% below the national rate. Its property crime rate of 1,171.7 is 24% below the national benchmark. In 2025, Iowa had the 16th-lowest violent crime rate and the 11th-lowest property crime rate among all states.
Iowa Cities With the Highest and Lowest Crime Rates
The following tables compare places with populations of at least 10,000. All rates represent reported offenses per 100,000 residents in 2025.
Cities with the highest property crime rates
| City or town | Property crime rate |
|---|---|
| Indianola | 3,248.6 |
| Davenport | 3,161.9 |
| Des Moines | 2,814.0 |
Cities with the highest violent crime rates
| City or town | Violent crime rate |
|---|---|
| Fort Dodge | 932.0 |
| Davenport | 652.0 |
| Des Moines | 640.6 |
Cities with the lowest property crime rates
| City or town | Property crime rate |
|---|---|
| Norwalk | 279.7 |
| North Liberty | 350.2 |
| Pella | 450.8 |
Cities with the lowest violent crime rates
| City or town | Violent crime rate |
|---|---|
| Pleasant Hill | 40.2 |
| Norwalk | 49.7 |
| Carroll | 59.5 |
Source: 2025 FBI Crime in the United States, Table 8. Rankings include places with at least 10,000 residents.
Pleasant Hill, a residential suburb of Des Moines, has the lowest violent crime rate among the 40 Iowa cities in our analysis, at 40.2 offenses per 100,000 residents. Norwalk follows at 49.7, and Carroll ranks third at 59.5. All three are well below the statewide rate of 233.9.
Norwalk also has the lowest property crime rate, at 279.7, making it the only city to appear in both low-rate groups. North Liberty, which boasts a young and growing population, had the second-lowest property crime rate at 350.2, with Pella, otherwise known as America’s Dutch Treasure, coming in third with a population-adjusted property crime rate of 450.8.
On the other end of the spectrum, Fort Dodge currently has the highest violent crime rate among the Iowa cities analyzed, at 932.0. Davenport follows at 652.0, and Des Moines ranks third at 640.6. Each is above the national violent crime rate of 327.6.
Fort Dodge’s own mayor came under scrutiny for alleged crimes in September 2025. Mayor Matt Bemrich was pulled over on the night of September 10 and charged with operating while intoxicated and improper use of lanes. Police said a breath test showed a .180, more than twice Iowa’s .08 legal limit. Bemrich pleaded not guilty.
The violence behind Davenport’s numbers was evident in November 2025, when a shooting outside Chill Vibez Lounge on North Myrtle Street left two men dead. Police said the incident began as a physical disturbance that escalated to gunfire and did not appear to be random. Two men, ages 21 and 36, were charged with two counts of first-degree murder, and a third was later charged as an accessory after the fact.
Indianola tops the list for property crime at 3,248.6 offenses per 100,000 residents, with Davenport (3,161.9) and Des Moines (2,814.0) close behind. Those two cities also rank in the top three for violent crime, so residents there face elevated risk on both fronts.
How Does Crime in Iowa Compare to Other States?
Iowa boasts the 11th-lowest property crime rate among the 50 states, 24% below the national rate. Motor vehicle theft is 40% lower in Iowa than the country as a whole. Larceny-theft rates are 23% lower, and burglary 12% lower.
Property crime rates
Offenses per 100,000 residents, 2025
| Crime type | Iowa | National |
|---|---|---|
| Property crime overall | 1,171.7 | 1,534.8 |
| Burglary | 170.4 | 193.6 |
| Larceny-theft | 883.9 | 1,144.1 |
| Motor vehicle theft | 117.3 | 197.0 |
The number of property crimes in Iowa decreased 11% between 2022 and 2025.
Iowa’s violent crime rate is 29% below the national benchmark. Robbery is 69% lower, murder and nonnegligent manslaughter 61% lower, and aggravated assault 24% lower. Rape rates in Iowa are much closer to the national figure, with just a 1% difference.
Violent crime rates
Offenses per 100,000 residents, 2025
| Crime type | Iowa | National |
|---|---|---|
| Violent crime overall | 233.9 | 327.6 |
| Murder and nonnegligent manslaughter | 1.6 | 4.1 |
| Aggravated assault | 181.1 | 238.0 |
| Robbery | 15.3 | 49.4 |
| Rape | 35.8 | 36.1 |
The number of violent crimes in Iowa decreased 17% between 2022 and 2025.
Is Iowa a Safe Place to Live?
For most Iowans, the numbers are reassuring. Statewide violent and property crime rates sit well below national levels, and Norwalk stands out with some of the lowest rates in both categories. Even so, crime varies widely from city to city. In Davenport, where the violent crime rate is among the state’s highest, police are using targeted violence-prevention strategies. Before choosing a place to live, look beyond the annual figures to recent local incidents and what city leaders are doing about them.
Where Our Crime Data Comes From
Unless specified otherwise, this article uses the FBI’s Crime in the United States tables. Statewide offense counts and published crime rates come from Table 5, national benchmarks come from Table 1, and city-level figures come from Table 8.
The state and national rate comparisons use 2025 data. Changes in Iowa’s violent and property crime counts compare 2022 with 2025. The trend percentages reflect changes in offense counts, rather than population-adjusted rates.
For the local rankings, we calculated violent and property crime rates per 100,000 residents using the 2025 dataset's populations and offense counts. We included only places with at least 10,000 residents. We included zero reported rates and all places tied at the cutoff for the three lowest-rate selections. Missing values were not treated as zero. State rankings compare the 50 states and exclude the District of Columbia.
Percentages are rounded to whole numbers, and crime rates are rounded to one decimal place. Calculations and rankings use unrounded values. Rankings describe the jurisdictions included in the dataset rather than every community in the state.
Important note: Crime statistics offer valuable insights, but they aren’t the only way to evaluate a community’s safety. Local context, law enforcement participation, reporting practices, population estimates, and geographic boundaries can influence the figures. A zero reported rate does not guarantee that no crime occurred. These comparisons do not establish why crime is higher or lower in a particular place.
Where Our Crime Data Comes From
Unless specified otherwise, the information in this article is based on crime data compiled by the FBI and made available through the Crime Data Explorer. Statewide violent and property crime statistics are drawn from the FBI’s 2023 Crime in the United States Report (Table 5) while metro area data comes from Table 6, which breaks down offenses by metropolitan statistical areas. For city-level crime rates, we referred to Table 8, which lists reported offenses by state and city.
Important note: Crime statistics offer valuable insights, but they aren’t the only way to evaluate a community’s safety. Local context, law enforcement practices and reporting standards can all influence how crime is recorded. Additionally, FBI publication tables and the data displayed on the Crime Data Explorer may differ slightly due to variations in methodology.