The Safest and Most Dangerous Cities in West Virginia
 |
November 11, 2026
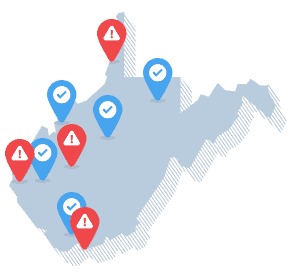
West Virginia’s crime picture depends on which offenses you examine. Both statewide rates are below national levels, and reported counts declined between 2022 and 2025. Within the state, Wheeling and Vienna occupy very different positions in the violent and property crime comparisons, making a single “safe” or “dangerous” label particularly unhelpful.
West Virginia has a violent crime rate of 241.7 offenses per 100,000 residents, 26% below the national rate. Its property crime rate of 1,053.3 is 31% below the national benchmark. Among the 50 states, it has the 20th-lowest violent crime rate and the ninth-lowest property crime rate.
Between 2022 and 2025, the number of violent crimes decreased 13%, while property crimes decreased 15%.
West Virginia Cities With the Highest and Lowest Crime Rates
The following tables compare places with populations of at least 10,000. All rates represent reported offenses per 100,000 residents in 2025.
Cities with the highest property crime rates
| City or town | Property crime rate |
|---|---|
| Beckley | 7,084.7 |
| South Charleston | 5,354.5 |
| Vienna | 3,903.8 |
Cities with the highest violent crime rates
| City or town | Violent crime rate |
|---|---|
| Wheeling | 820.1 |
| Beckley | 715.8 |
| Huntington | 669.7 |
Cities with the lowest property crime rates
| City or town | Property crime rate |
|---|---|
| Weirton | 331.1 |
| Fairmont | 1,146.0 |
| Wheeling | 1,620.8 |
Cities with the lowest violent crime rates
| City or town | Violent crime rate |
|---|---|
| Weirton | 82.8 |
| St. Albans | 117.9 |
| Vienna | 173.9 |
Source: 2025 FBI Crime in the United States, Table 8. Rankings include places with at least 10,000 residents. Zero reported crime rates and ties at the cutoff are included; rankings use unrounded values.
West Virginia Communities With the Lowest and Highest Crime
Weirton has the lowest violent crime rate among West Virginia’s 12 qualifying cities, at 82.8 offenses per 100,000 residents. St. Albans at 117.9 and Vienna at 173.9 follow. Weirton reported 15 violent crimes among 18,123 residents.
Weirton also has the lowest property crime rate, 331.1, based on 60 offenses. Fairmont at 1,146.0 and Wheeling at 1,620.8 round out the group. Fairmont exceeds the statewide property crime rate, and Wheeling exceeds both the statewide and national figures, despite their relatively low positions within this comparison.
Wheeling has the highest violent crime rate at 820.1, followed by Beckley at 715.8 and Huntington at 669.7. All three exceed twice the national violent crime benchmark.
That high ranking does not mean Wheeling’s crime is rising. The police department’s 2025 year-end report described decreases from 2024 in assaults, burglary, robbery, and theft. Police Chief Shawn Schwertfeger credited cooperation between the department and the community. Those local trends provide useful context, while the study’s rankings compare 2025 rates across cities.
Beckley has the highest property crime rate at 7,084.7, with South Charleston at 5,354.5 and Vienna at 3,903.8 next. Vienna’s place among the lowest violent crime rates therefore comes alongside one of the highest property crime rates in the dataset.
Beckley is home to WVU Tech’s downtown campus. For people moving there for work or study, its elevated rates in both categories make the location of housing and parking worth investigating closely. Review recent incidents near the buildings and routes you would use; the citywide totals do not show whether those particular areas share the same pattern.
How Does Crime in West Virginia Compare to Other States
West Virginia has the ninth-lowest property crime rate among the states, 31% below the national benchmark. Motor vehicle theft is 66% lower, larceny-theft 27% lower, and burglary 23% lower.
Property crime rates
Offenses per 100,000 residents, 2025
| Crime type | West Virginia | National |
|---|---|---|
| Property crime overall | 1,053.3 | 1,534.8 |
| Burglary | 148.2 | 193.6 |
| Larceny-theft | 838.8 | 1,144.1 |
| Motor vehicle theft | 66.2 | 197.0 |
The number of property crimes in West Virginia decreased 15% between 2022 and 2025.
Reported property crimes: 21,836 in 2022 and 18,602 in 2025.
The overall violent crime rate is 26% below the national figure, but reported rape is 45% higher. Robbery is 83% lower, aggravated assault 26% lower, and murder and nonnegligent manslaughter 7% lower. The low overall rate should not obscure that above-average rape rate.
Violent crime rates
Offenses per 100,000 residents, 2025
| Crime type | West Virginia | National |
|---|---|---|
| Violent crime overall | 241.7 | 327.6 |
| Murder and nonnegligent manslaughter | 3.8 | 4.1 |
| Aggravated assault | 177.1 | 238.0 |
| Robbery | 8.5 | 49.4 |
| Rape | 52.4 | 36.1 |
The number of violent crimes in West Virginia decreased 13% between 2022 and 2025.
Reported violent crimes: 4,934 in 2022 and 4,269 in 2025.
Percentage changes reflect offense counts, rather than population-adjusted crime rates.
Is West Virginia a Safe Place to Live
Weirton has low rates in both categories, while Wheeling and Vienna show why crime types should be considered separately. A prospective resident may have different concerns about violence, vehicle theft, or burglary. Start with the category that matters to your situation, then look for recent information about the specific neighborhood rather than relying on a city’s overall reputation.
Where Our Crime Data Comes From
Unless specified otherwise, the information in this article is based on the FBI’s Crime in the United States tables. Statewide offense counts and published crime rates come from Table 5, national benchmarks come from Table 1, and city-level figures come from Table 8.
The state and national rate comparisons use 2025 data. Changes in West Virginia’s violent and property crime counts compare 2022 with 2025. The trend percentages reflect changes in offense counts, rather than population-adjusted rates.
For the local rankings, we calculated violent and property crime rates per 100,000 residents using the populations and offense counts in the 2025 dataset. Only places with at least 10,000 residents were eligible. We included zero reported rates and all places tied at the cutoff for the three lowest-rate selections. Missing values were not treated as zero. State rankings compare the 50 states and exclude the District of Columbia.
Percentages are rounded to whole numbers, and crime rates are rounded to one decimal place. Calculations and rankings use unrounded values. Rankings describe the jurisdictions included in the dataset rather than every community in the state.
Important note: Crime statistics offer valuable insights, but they aren’t the only way to evaluate a community’s safety. Local context, law enforcement participation, reporting practices, population estimates, and geographic boundaries can influence the figures. A zero reported rate does not guarantee that no crime occurred. These comparisons do not establish why crime is higher or lower in a particular place.