The Safest and Most Dangerous Cities in Oregon
 |
August 18, 2025
|
August 18, 2025
Oregon Security Solutions
The following is a list of cities that provide home security solutions in the state of Oregon
If you grew up playing The Oregon Trail video game, you know about the hardships some 400,000 American pioneers endured on their trek west in the mid-19th century. Disease, Native American attacks, and dangerous river and mountain crossings were among the deadliest threats.
However, the 2,200-mile east-west route from Independence, Missouri, to Oregon City, Oregon, continued to beckon individuals, groups, and families in search of adventure, riches, or simply a fresh start in the West.
So many wagons traversed the Oregon Trail that you can still see their ruts at some points, including near the National Historic Oregon Trail Interpretive Center in Baker City, Oregon. That adventurous spirit is alive and well in Oregon today. Oregonians love the scenic beauty of their state, which ranges from its rugged Pacific coastline to rolling valleys framed by majestic volcanic peaks.
In terms of crime, Oregon ranks in the middle of the 50 states in terms of violent cases. However, the largely rural state ranks fifth in property crimes.
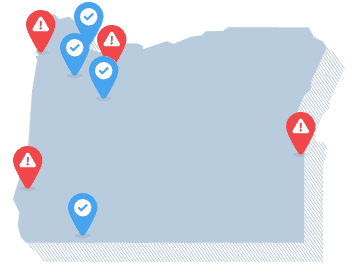
Oregon cities with the highest and lowest crime rates
(per 100,000 people)
| Cities with the highest property crime rates | |
|---|---|
| Portland | 5,861 |
| Seaside | 5,430 |
| Coos Bay | 5,391 |
| Cities with the highest violent crime rates | |
|---|---|
| Coos Bay | 964 |
| Portland | 715 |
| Ontario | 672 |
| Cities with the lowest property crime rates | |
|---|---|
| Gervais | 272 |
| Columbia City | 413 |
| Banks | 444 |
| Cities with the lowest violent crime rates | |
|---|---|
| Talent | 16 |
| Mount Angel | 29 |
| Scappoose | 48 |
Note: Excluding cities with crime rates of zero. Source: 2023 FBI Data
Oregon Cities With the Lowest Crime
Oregon’s most populous county (811,880) is Multnomah County, home to Portland, the state’s largest metropolitan area. Nearby Washington County (597,695) is the second most populous. However, the expansive Beaver State has seven counties with a population below 10,000.1
Southern Oregon’s Jackson County is home to the small city of Talent (population just over 6,000), which has the state’s lowest violent crime rate. With only 16 incidents per 100,000 residents every year, Talent is a short drive down I-5 from Ashland, the home of Southern Oregon University and the renowned Oregon Shakespeare Festival.
Mount Angel, located 18 miles northeast of the state capital, Salem, is a small tourist town (population around 3,500) with the state’s second-lowest violent crime rate. Despite drawing hundreds of thousands of visitors each year to enjoy its Oktoberfest celebrations and Old World charm, Mount Angel is a safe place to live.
Another small city in the Salem Metropolitan area has one of the state’s lowest property crime rates. Gervais (population of about 2,500) is a largely rural community with a property crime rate of 272 per 100,000 residents yearly.
Oregon Cities With the Highest Crime
Statewide, the most common violent crime in Oregon is aggravated assault, with a rate of 219 per 100,000 people. According to the FBI’s definition, this crime category typically involves the use of a weapon or other means likely to cause bodily harm.2
The city of Coos Bay (population about 16,000), situated where the Coos River enters the Pacific Ocean’s Coos Bay, has Oregon’s highest violent crime rate (964 per 100,000 residents). Contributing factors include a depressed job market and a high cost of living, both of which have led to an increase in drug use in this city near the southern entrance to the popular Oregon Dunes National Recreation Area.
Portland, the state’s most populous city (population about 630,000), ranks second in violent crime with an annual rate of 715 per 100,000 residents. However, Rose City, the nickname it earned for its lovely rose gardens, ranks first in the state in property crimes. Crimes against property are crimes of theft, where no force or threat of force is directed against an individual.
In 2020, Portland frequently made national news headlines following the death of George Floyd in Minneapolis for destructive downtown riots that drew federal troop involvement.3 Although the city has rebuilt and mostly moved on since those tumultuous days, its post-pandemic recovery has lagged behind other cities.4
According to the Common Sense Institute, the reasons behind the high property crime in Portland now are a complicated mix of the aftermath of Measure 110, which decriminalized the use of small amounts of drugs, delays in funding addiction treatment, and rising public safety and health care costs.5
How Does Oregon’s Crime Rate Compare to Other States?
Oregon ranks 26th in the nation for violent crime and fifth for property crime. The state’s violent crime rate (326 per 100,000 people) is 10 percent below the U.S. average and represents a -4.7 percent year-over-year (YOY) change. The crime of murder in Oregon is 21.1 percent lower than the national average.
Violent crime rates (per 100,000)
| Category | Oregon | National |
|---|---|---|
| Murder/Non-negligent homicide | 4.5 | 5.7 |
| Aggravated assault | 219.0 | 263.7 |
| Robbery | 62.4 | 65.4 |
| Rape | 40.4 | 38.0 |
By contrast, Oregon’s property crime rate of 2,591 per 100,000 people is 35 percent above the national average, representing a -11.7 percent YOY change. The most common violent crime in the state is aggravated assault (219), and larceny theft (1,837.5) is the most common property crime. Vehicle theft is 29.7 percent above the national average.
Property crime rates (per 100,000 residents)
| Category | Oregon | National |
|---|---|---|
| Burglary | 339.8 | 250.7 |
| Larceny | 1837.5 | 1343.9 |
| Vehicle theft | 413.4 | 317.2 |
Despite the soaring crime rates, there is some good news for Oregon: A report from the National Insurance Crime Bureau shows a 30 percent drop in vehicle thefts in Oregon. This decrease represents the third-largest drop in vehicle thefts in the U.S. in 2024.6
Navigate Crime Data by State
- Alabama
- Alaska
- Arizona
- Arkansas
- California
- Colorado
- Connecticut
- Delaware
- Florida
- Georgia
- Hawaii
- Idaho
- Illinois
- Indiana
- Iowa
- Kansas
- Kentucky
- Louisiana
- Maine
- Maryland
- Massachusetts
- Michigan
- Minnesota
- Mississippi
- Missouri
- Montana
- Nebraska
- Nevada
- New Hampshire
- New Jersey
- New Mexico
- New York
- North Carolina
- North Dakota
- Ohio
- Oklahoma
- Pennsylvania
- Rhode Island
- South Carolina
- South Dakota
- Tennessee
- Texas
- Utah
- Vermont
- Virginia
- Washington
- West Virginia
- Wisconsin
- Wyoming
Where Our Crime Data Come From
Unless specified otherwise, the information in this article is based on crime data compiled by the FBI and made available through the Crime Data Explorer. Statewide violent and property crime statistics are drawn from the FBI’s 2023 Crime in the United States Report (Table 5) while metro area data comes from Table 6, which breaks down offenses by metropolitan statistical areas. For city-level crime rates, we referred to Table 8, which lists reported offenses by state and city.
Important note: Crime statistics offer valuable insights, but they aren’t the only way to evaluate a community’s safety. Local context, law enforcement practices, and reporting standards can all influence how crime is recorded. Additionally, FBI publication tables and the data displayed on the Crime Data Explorer may differ slightly due to variations in methodology.
Citations
- World Population Review. (2024). Oregon Counties by Population.
https://worldpopulationreview.com/us-counties/oregon - Federal Bureau of Investigation. (2017). Aggravated Assault – Crime in the U.S. 2017.
https://ucr.fbi.gov/crime-in-the-u.s/2017/crime-in-the-u.s.-2017/topic-pages/aggravated-assault - The New York Times. (2020, Jul 31). Portland Protests: What Happened and Where.
https://www.nytimes.com/interactive/2020/07/31/us/portland-protests-map-photos.html - The Oregonian/OregonLive. (2025, Mar 4). 5 years later, Portland lags other cities as it nurses pandemic-era wounds.
https://www.oregonlive.com/business/2025/03/5-years-later-portland-lags-other-cities-as-it-nurses-pandemic-era-wounds.html - Common Sense Institute. (2024). The Cost of Crime in Oregon.
https://www.commonsenseinstituteus.org/oregon/research/crime-and-public-safety/cost-of-crime-in-oregon - National Insurance Crime Bureau. (2024, May 14). Vehicle Thefts in the United States Fell 1.7% in 2024.
https://www.nicb.org/news/news-releases/vehicle-thefts-united-states-fell-17-2024