The Safest and Most Dangerous Cities in Mississippi
 |
August 21, 2025
|
August 21, 2025
Mississippi Security Solutions
The following is a list of cities that provide home security solutions in the state of Mississippi
Mississippi — the birthplace of blues music — ranks in the bottom third of states for crime rates in the United States. While overall crime remains higher than average in Mississippi, the silver lining is that it is currently trending downward. In the Magnolia State, violent crime was down 17 percent between 2022 and 2023. With one of the U.S.’s lowest housing costs and a well below-average cost of living, Mississippi has big appeal for many Americans.
Only Washington, D.C., has more homicide deaths than Mississippi,1 making it one of the least safe states overall. But that figure doesn’t tell the whole story. The state’s average crime rates are heavily influenced by Mississippi’s capital city of Jackson, which has more violent crime per capita than the rest of the state and impacts the average. In 2020, only 6 percent of the state’s population resided in Jackson, but more than 50 percent of all reported state homicides were committed there.2 However, due to underfunded and understaffed law enforcement agencies and the transition to a new federal crime database, Jackson’s crime rates have not been reported and reflected accurately in recent FBI statistics.3
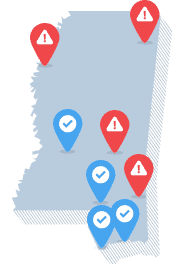
Mississippi cities with the highest and lowest crime rates
(per 100,000 people)
| Cities with the highest property crime rates | |
|---|---|
| Laurel | 4,922 |
| Corinth | 4,673 |
| Lucedale | 4,494 |
| Cities with the highest violent crime rates | |
|---|---|
| Laurel | 1,016 |
| West Point | 889 |
| Cleveland | 682 |
| Cities with the lowest property crime rates | |
|---|---|
| Brandon | 342 |
| Florence | 377 |
| Petal | 379 |
| Cities with the lowest violent crime rates | |
|---|---|
| Long Beach | 17 |
| Waveland | 29 |
| Flowood | 37 |
Note: Excluding cities with crime rates of zero. Source: 2023 FBI Data
Low Crime Enclaves in Mississippi
Brandon has one of Mississippi’s lowest property crime rates. A suburb of the capital city, Brandon is located just 11 miles east of Jackson. Being so close to crime-riddled Jackson, Brandon’s low property crime rate comes as a pleasant surprise. One of the fastest growing cities in the state with a population of 25,000, Brandon is consistently ranked as one of the Top 10 best places to live in Mississippi as well as one of the Top 10 safest places to live in Mississippi.4 It also made Forbes’ list of Top 100 Small Towns in America. The city’s safest status can be attributed to a commitment to public safety and well-planned community development.
Located 14 miles to Brandon’s south is Florence, Mississippi’s second-ranked city for lowest property crime rates. The small town has slightly less than 5,000 residents, about a quarter of the size of neighboring Brandon. It’s known for its charm and attracts mostly families, which likely contributes to its low property crime rates.
The small coastal town of Long Beach boasts one of the lowest violent crime rates in the state of Mississippi. With just around 15,000 residents, Long Beach is situated 17 miles west of Biloxi. Without the glitzy casinos that dominate Biloxi, Long Beach is known as “The Friendly City” and promotes a more low-key brand of tourism than other beach destinations in the south. The city claims that many of its residents are descendants of its original settlers, marking their commitment to the community.
Long Beach is well-known for its top-tier school district, garnering an ‘A' rating from the Mississippi Department of Education. It’s home to two nationally recognized Blue Ribbon schools.5 The city's low crime rates can be attributed in part to its robust culture of and commitment to education, its tight-knit community and an economy boosted by tourism.
Just 16 miles west of Long Beach lies the city of Waveland, with the second-lowest violent crime rate in the state. Known as the “Hospitality City,” Waveland is also a tourist destination with a beautiful beachfront and plenty of recreational activities. In 2023, the crime rate was just 29 reports of violent crime per 100,000.
Laurel Takes the Lead in Violent and Property Crime
The unassuming, small town of Laurel looks great on TV. Laurel, Mississippi is the star of HGTV’s home makeover show, “Home Town,” but according to FBI crime data, it’s one of the last places in Mississippi you’d want to call home.
Laurel is the least safe city in the state when it comes to both violent and property crimes. With nearly 5,000 property crime incidents per 100,000 people and slightly more than 1,000 violent crime incidents per 100,000 people, the crime rates are well above the state and national average.
Like the rest of Mississippi, Laurel’s crime rates are a reflection of its history — one fraught with race-based social and educational disparity, violence and economic oppression. In addition, Laurel has consistently faced an underfunded and understaffed police department, leading to higher crime rates, which, in reality, are likely higher than reported.
The good news is Laurel isn’t resting on its laurels — the city has experienced somewhat of a renaissance in the last decade. With the renewed interest in Laurel garnered by “Home Town,” and the revitalization of Main Street that followed, paired with approved pay raises for law enforcement in 2024 to compete better with surrounding departments and local industry, there is hope yet for this small Mississippi town to turn over a new leaf.
Mississippi’s Crime Over Time
Mississippi’s historical and cultural landscape, namely a reluctance to industrialize quickly and racial disparity in the wake of the Jim Crow laws that dominated the post-Reconstruction era, contributes to the state’s high poverty rates.
With the lowest average income in the U.S., nearly 18% of Mississippi residents live below the poverty line.6 Data collected from 2019-2023 paints a clear picture: Mississippi ranks 51st, or last, in the U.S. for the number of people living below the poverty line.7
Property and violent crime rates
(per 100,000 residents)
| Crime Type | Mississippi | National |
|---|---|---|
| Burglary | 304.3 | 250.7 |
| Larceny | 1093.3 | 1343.9 |
| Vehicle theft | 189.5 | 317.2 |
| Murder/Non-negligent homicide | 6.9 | 5.7 |
| Aggravated assault | 141.8 | 263.7 |
| Robbery | 21.4 | 65.4 |
| Rape | 32.6 | 38.0 |
The correlation between crime rates and poverty levels has been increasingly linked and Mississippi is no exception. Areas with greater instances of economic distress, including things like foreclosures, unemployment and high homelessness rates, experience higher crime rates than areas that are more economically advantaged.
Although violent crime rates had been trending significantly higher over the last decade, rates actually decreased from 2022-2023 by 17% and property crime decreased by 9%. While still well below the national average, crime rates are starting to improve in Mississippi.
Where Our Crime Data Comes From
Unless specified otherwise, the information in this article is based on crime data compiled by the FBI and made available through the Crime Data Explorer. Statewide violent and property crime statistics are drawn from the FBI’s 2023 Crime in the United States Report (Table 5) while metro area data comes from Table 6, which breaks down offenses by metropolitan statistical areas. For city-level crime rates, we referred to Table 8, which lists reported offenses by state and city.
Important note: Crime statistics offer valuable insights, but they aren’t the only way to evaluate a community’s safety. Local context, law enforcement practices and reporting standards can all influence how crime is recorded. Additionally, FBI publication tables and the data displayed on the Crime Data Explorer may differ slightly due to variations in methodology.
Navigate Crime Data by State
- Alabama
- Alaska
- Arizona
- Arkansas
- California
- Colorado
- Connecticut
- Delaware
- Florida
- Georgia
- Hawaii
- Idaho
- Illinois
- Indiana
- Iowa
- Kansas
- Kentucky
- Louisiana
- Maine
- Maryland
- Massachusetts
- Michigan
- Minnesota
- Missouri
- Montana
- Nebraska
- Nevada
- New Hampshire
- New Jersey
- New Mexico
- New York
- North Carolina
- North Dakota
- Ohio
- Oklahoma
- Oregon
- Pennsylvania
- Rhode Island
- South Carolina
- South Dakota
- Tennessee
- Texas
- Utah
- Vermont
- Virginia
- Washington
- West Virginia
- Wisconsin
- Wyoming
Citations
Centers for Disease Control and Prevention. (2024). Homicide Mortality by State.
https://www.cdc.gov/nchs/pressroom/sosmap/homicide_mortality/homicide.htm
Empower Mississippi. (2024). How Bad Is Crime in Mississippi?
https://empowerms.org/how-bad-is-crime-in-mississippi/
The Marshall Project. (2022, Aug 15). See If Police in Your State Reported Crime Data to the FBI.
https://www.themarshallproject.org/2022/08/15/see-if-police-in-your-state-reported-crime-data-to-the-fbi
City of Brandon. (2024). History of Brandon.
https://brandonms.org/live-play/history-of-brandon/
City of Long Beach, Mississippi. (2024). Official Website of Long Beach, MS.
https://www.cityoflongbeachms.info/
U.S. Census Bureau. (2024). Mississippi: Median Household Income (2022).
https://www.census.gov/quickfacts/fact/table/MS/INC110223
Health Resources and Services Administration. (2024). Mississippi State Overview.
https://mchb.tvisdata.hrsa.gov/Narratives/Overview/9a62acf8-1ab6-4e9a-b92f-9037110117e7