Best & Worst Cities for Families
 |
December 5, 2025
|
December 5, 2025
For any parent, deciding where to put down roots is a complex calculation. Do you need to live near your family? What about the school system? How long of a commute to work can you stand? What can you afford for a housing payment?
This challenging balancing act can have huge consequences — academic research has found that moving to a new home during childhood can have a negative impact on kids’ school performance, behavior and social skills.
Finding a place in the sweet spot for your family is important, not just for your kids but for you, too. After all, in addition to creating emotional upheaval, moving is expensive. The average cost of moving within the same state costs around $1,250 for a local move, while an interstate move costs nearly $5,000 depending on distance and household size.1
So which U.S. cities provide the best setting in which to raise children?
We wanted to use data to figure out which cities are the best (and worst) for families, so we compared hundreds of cities across a range of metrics that cover things like housing affordability, access to parks, crime rates and other factors that go into making a community attractive for parents and children.
What we found was that among the cities that scored the best, there was a huge degree of geographic diversity, though the Midwest does dominate the top 10. Conversely, every city in the bottom 10 is located in either the South or the West.
Complete Ranking
To ensure an apples-to-apples comparison, we’ve winnowed our list to the 65 U.S. cities and metro areas for which data was available in every category we measured. You can jump to the bottom of the page for a full look at our methodology, but here’s a quick-and-dirty explanation for how to read the overall ranking: The lower a city’s numerical score, the more attractive that city is to raise a family.
Two Midwestern cities that are roughly a four-hour drive apart claim our top spots. Madison, the Wisconsin state capital, earned the best score in our analysis. Across our 10 metrics, this city of about 270,000 residents consistently ranked at or near the top. The Twin Cities of Minneapolis-St. Paul, Minnesota grabbed second place with a score of 131. It trails Madison but maintains a comfortable lead over the third-place cities of Washington, D.C. and Boston, which tied.
Every region of the country is represented in the top 10, with the Midwest accounting for both the top two and four of the top 10 overall. The West has three cities in the top 10, and the District of Columbia is the only Southern city among the 10 with the best scores.
The average score among all cities was 312, and a total of 27 cities had better scores than that. Among that group of states, Ohio boasts three and California and Wisconsin two each.
Tucson was the worst-performing city on our list, but Bakersfield, California was hot on Tucson’s heels, with just five points separating the two cities. California has four cities in the bottom 10, while Texas has two.
Breaking Them Down:
15 Best Cities
Let's explore why the 15 top-scoring cities earned their spots by examining their performance across our 10 key metrics:
Pro Tip: When evaluating cities for your family, consider creating a weighted scorecard based on what matters most to you. If school quality is paramount, give education metrics more weight. If outdoor activities are essential, prioritize park access and recreation options.
Breaking Them Down:
15 Worst Cities
Now let's examine why the lowest-ranking cities struggled in our analysis:
Best & Worst by Category
While we weighted each category equally in our analysis, every family has different priorities. Some parents might prioritize low crime rates over park proximity, while others value educational opportunities above all else. Here's how cities performed in each individual category we examined:
Personalize It: Use these category-specific rankings to identify cities that excel in your must-have areas. A city that ranks middle-of-the-pack overall might be perfect if it excels in the categories you value most.
Conclusion
It takes a village to raise a child, as they say. For parents who have the freedom to choose where they put down roots, it’s pretty clear that some villages are better than others. Our analysis reveals that most cities require trade-offs with dramatic gaps between top and bottom performers. While it’s no guarantee of happiness or long-term success in life, starting your kids out on the right foot means living in a community that provides them with as many opportunities as possible.
About This Report
Here's our complete methodology and data sources for calculating these rankings:
Methodology: We collected data across 10 key categories for hundreds of major U.S. cities. Since not every city had complete data available, we focused on 65 major American cities with data in all (or nearly all) categories. We ranked each city from best to worst (1-65) in each category, then summed these rankings to create our overall scores. Lower total scores indicate more family-friendly cities.
Crime rates: We calculated an average crime rate for each city/metro area using data published by the FBI. That covers rates of both violent crime and property crime.
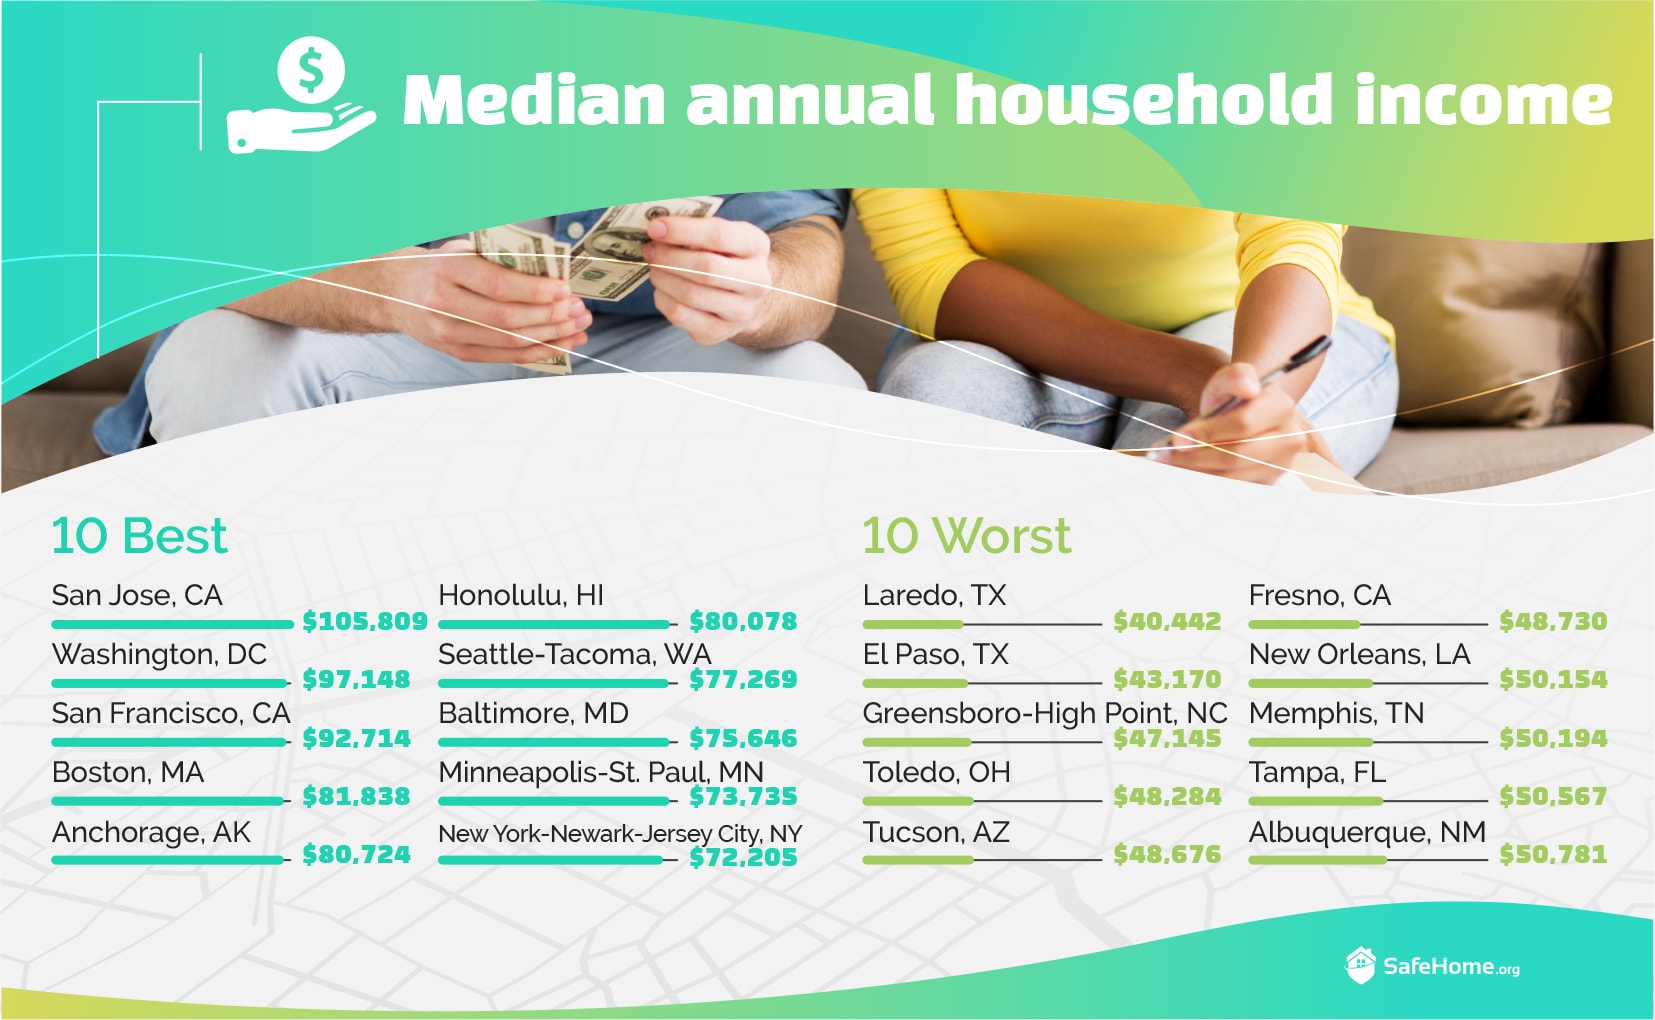
Household income: We used U.S. Census Bureau data that lists the median annual household income by city and/or metro area.
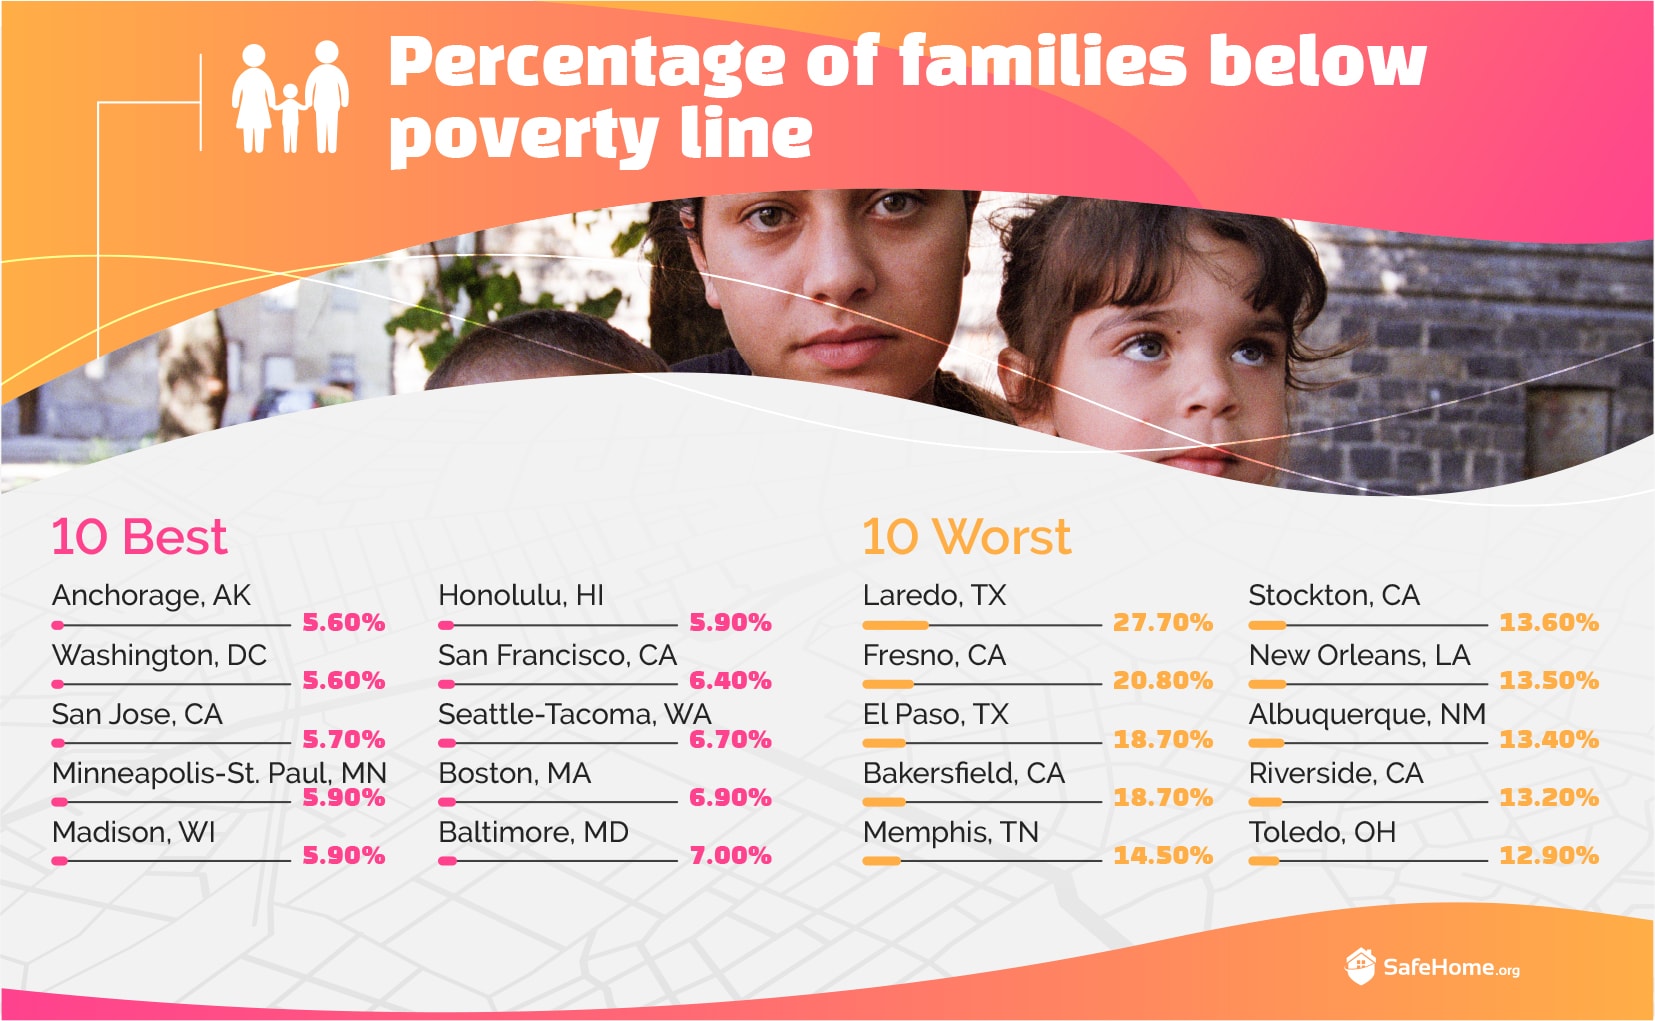
Poverty rate: We used a Census Bureau table that details the percentage of families living below the poverty line in each city.
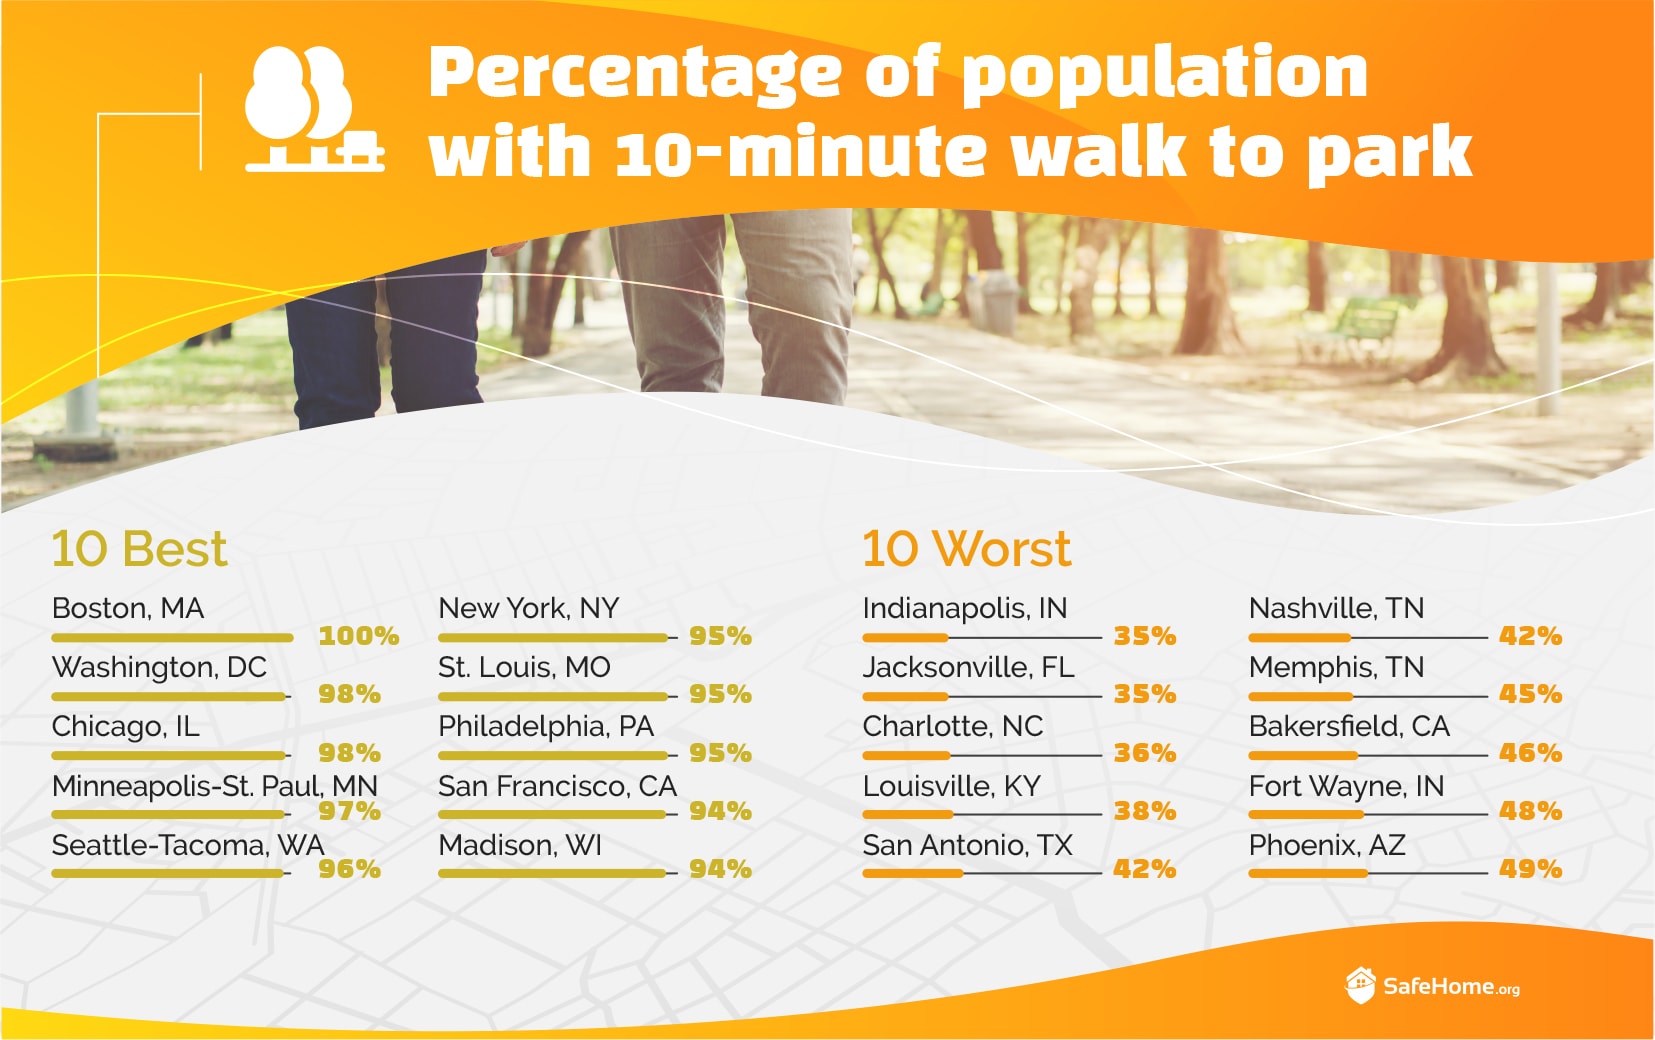
Proximity to parks: We used a figure on the percentage of people in each city living within a 10-minute walk to a park; this information was published by the Trust for Public Lands.
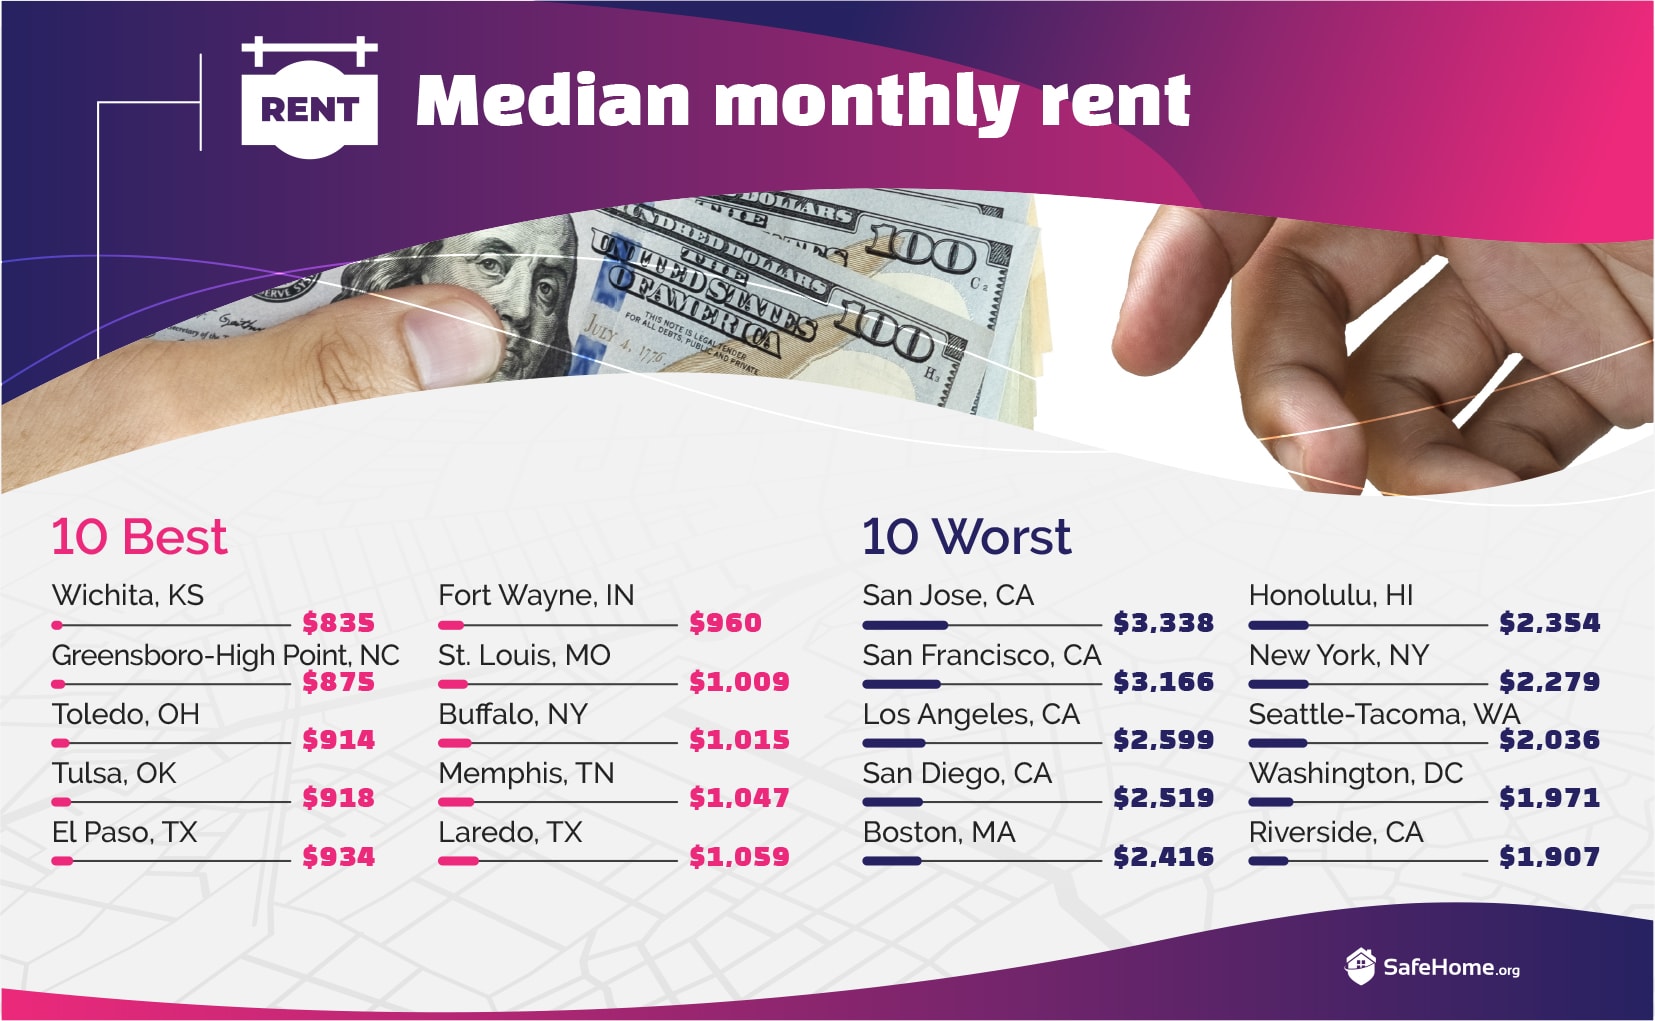
Rent: We used Zillow’s proprietary index that calculates median rental rates in each city.
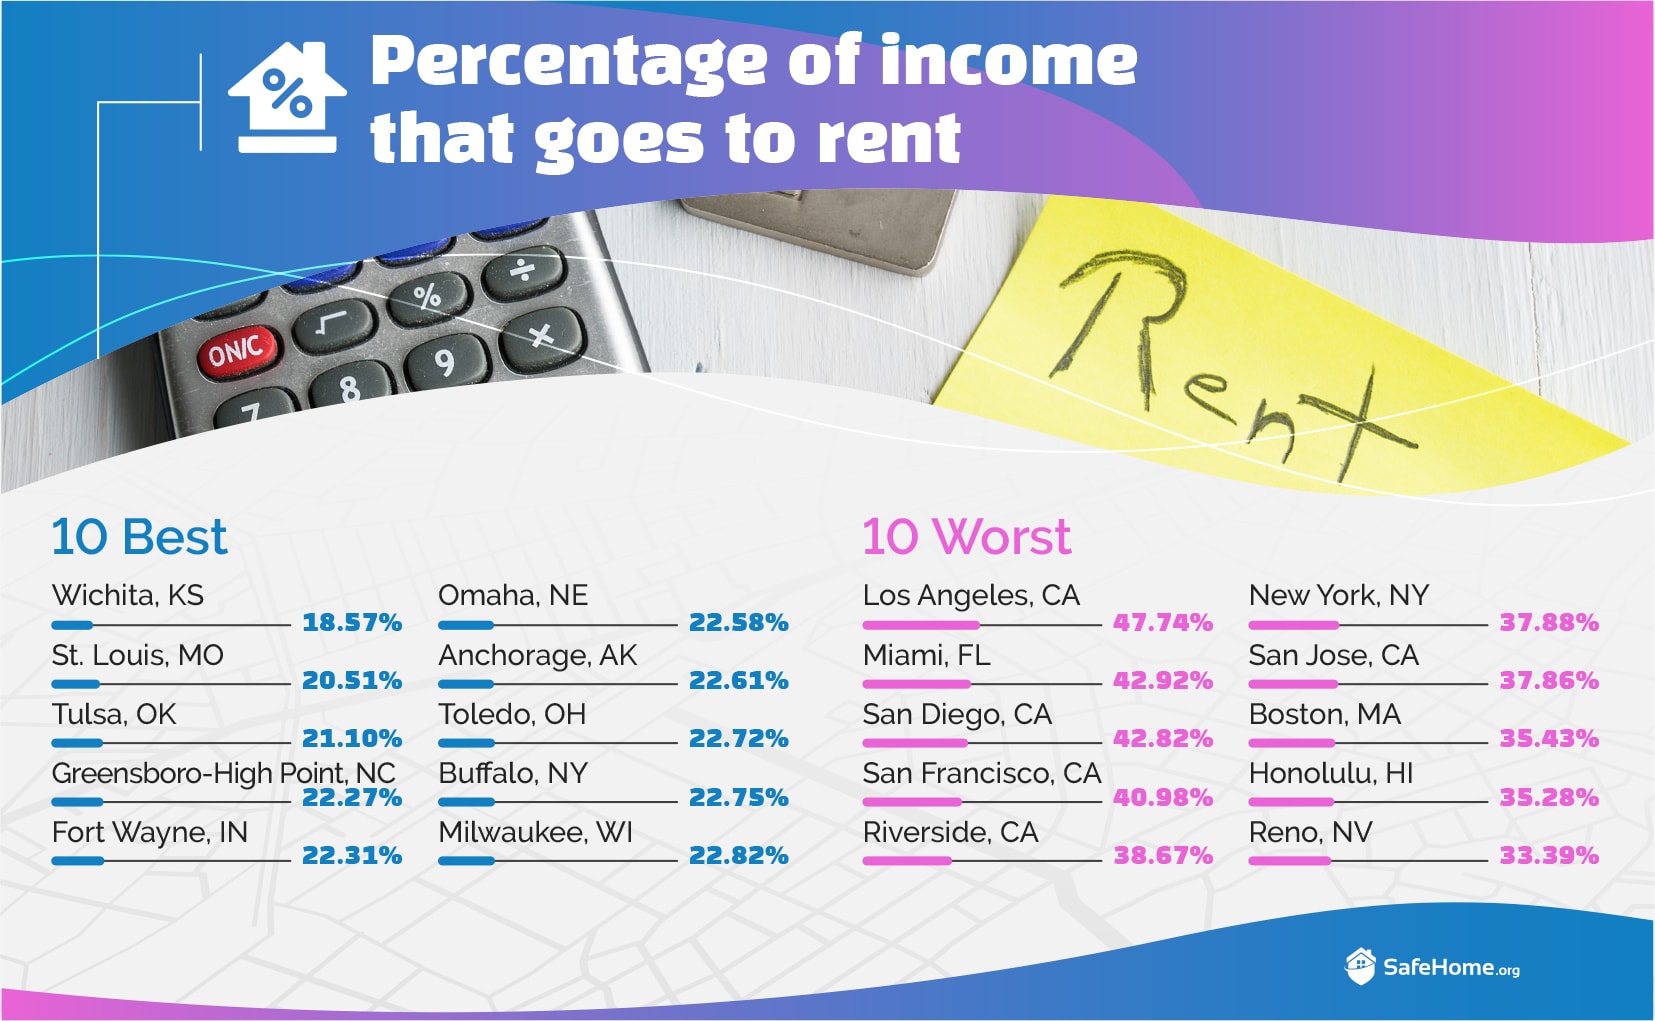
Housing affordability: We calculated the percentage of monthly household income that goes to rent by dividing the median annual household income by 12 and dividing the median monthly rent figure by that amount.
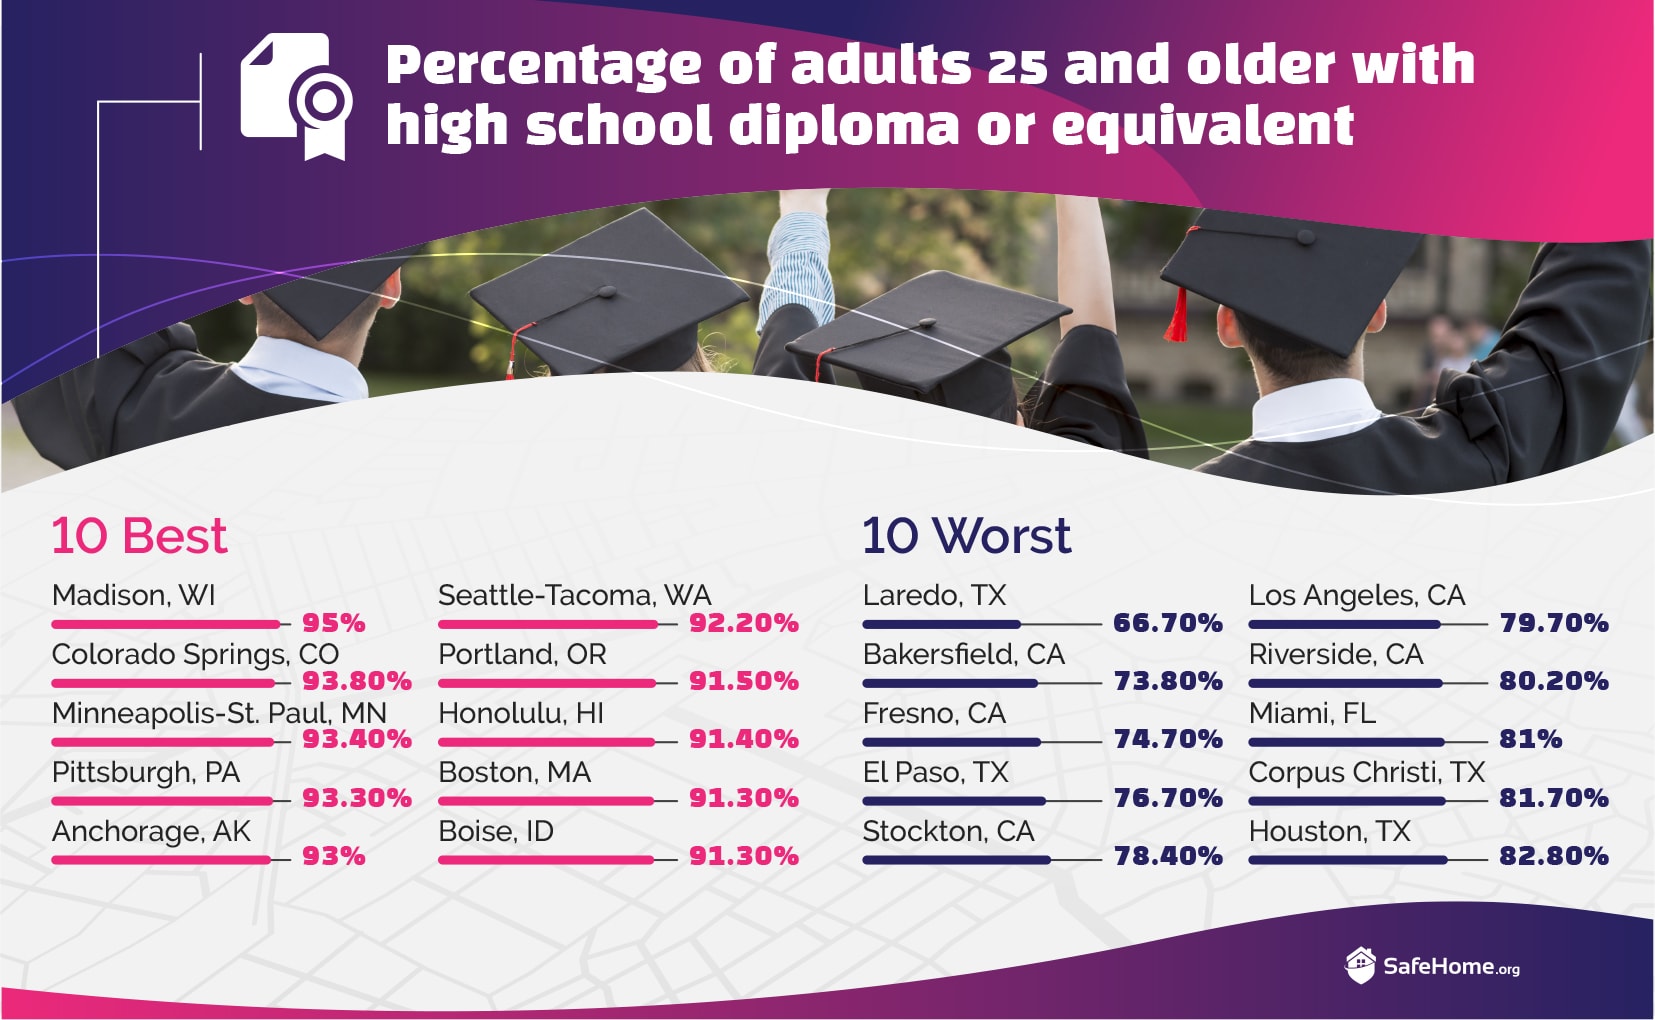
High school completion: We used a Census Bureau table that lists the percentage of people in each city 25 and older who have a high school diploma or equivalency certificate.
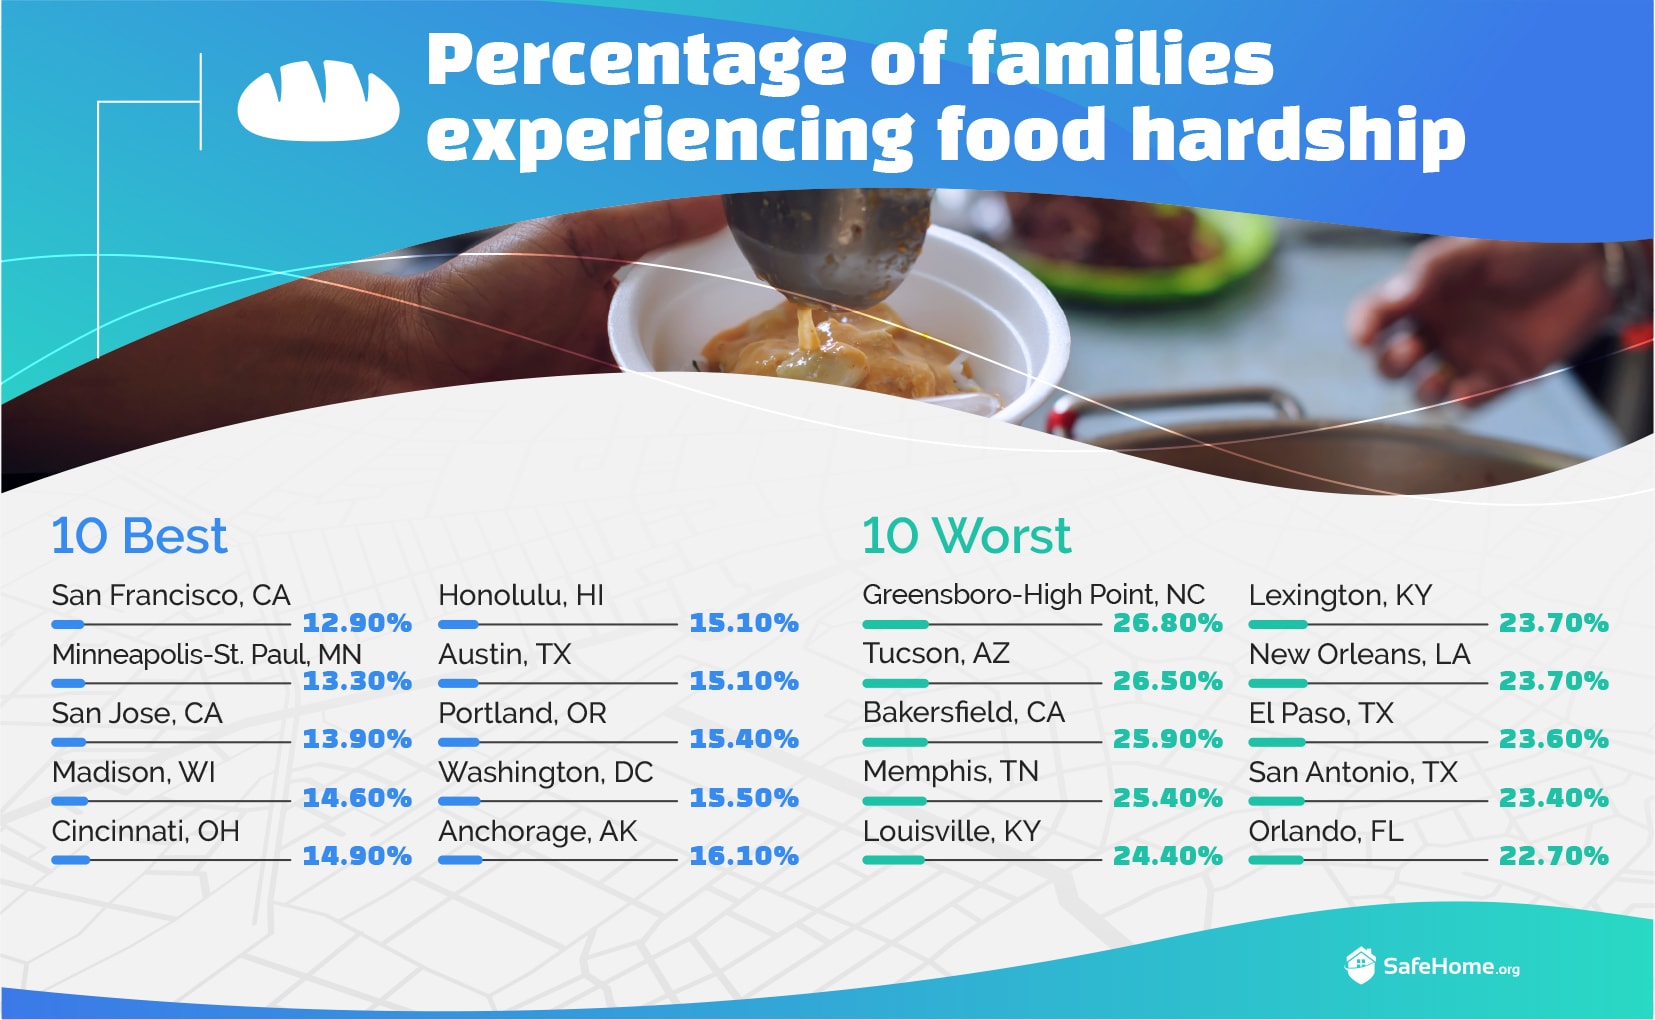
Food hardship: We used data from the Food Research Action Center that estimates in each city the percentage of families with children who have experienced food hardship or scarcity, which is defined by a household inability to afford food. Data was unavailable for a few cities, and in those cases, state-level data was substituted.
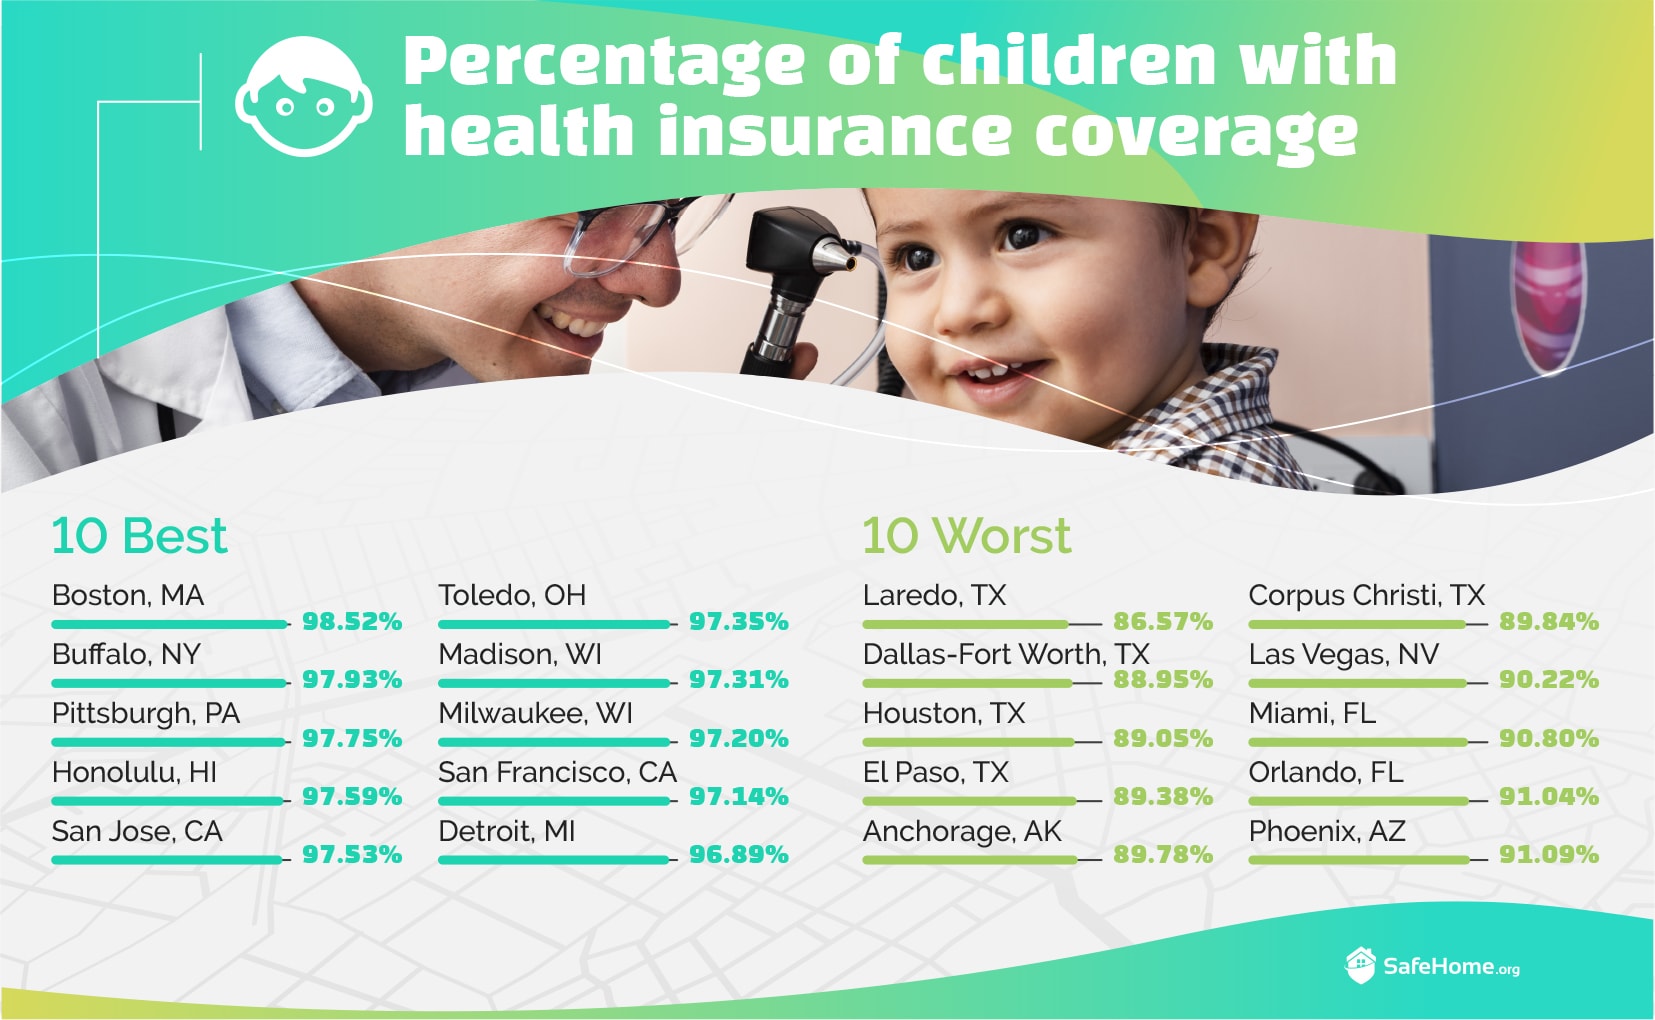
Health insurance: We calculated the percentage of children with health insurance coverage based on a table published by the Census Bureau.
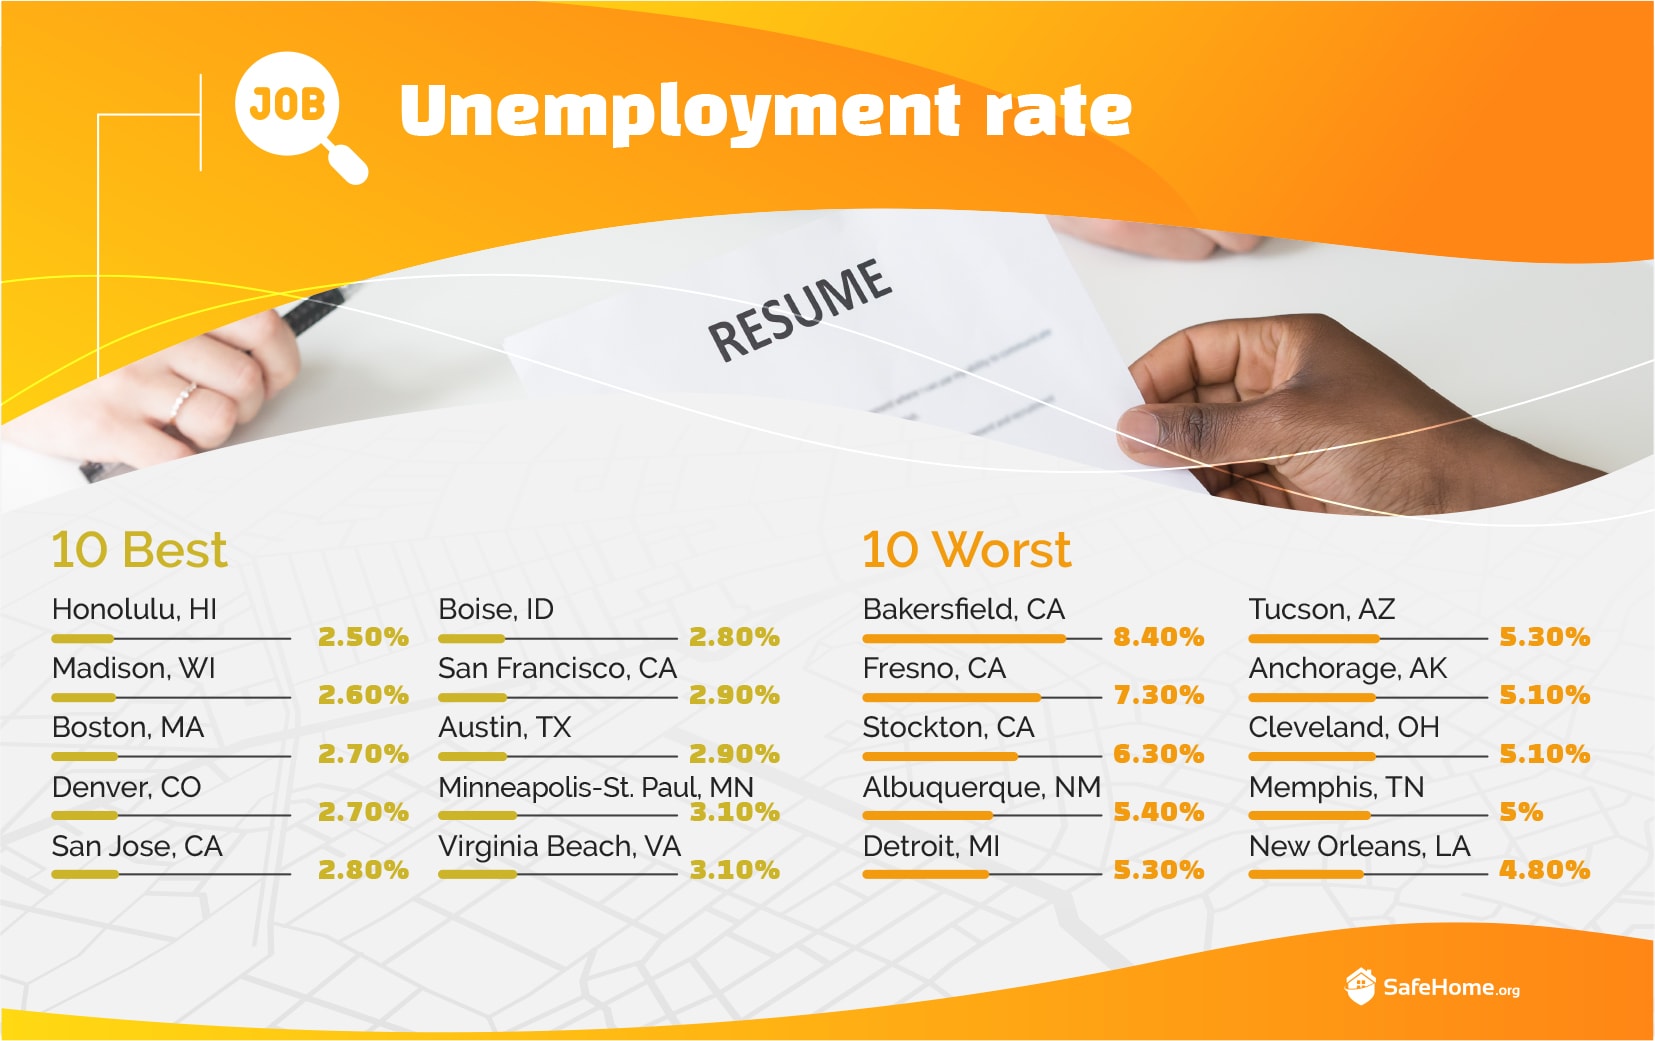
Unemployment rate: We used the most recently available unemployment rate for each city or metro area, published monthly by the U.S. Department of Labor.
Citations
moving.com. (Retrieved 2025). Moving Cost Calculator for Moving Estimates.
https://www.moving.com/movers/moving-cost-calculator.asp