The Best & Worst States for Climate Change in the U.S.
- Coastal states like Florida and South Carolina are most at risk of the impacts of climate change.
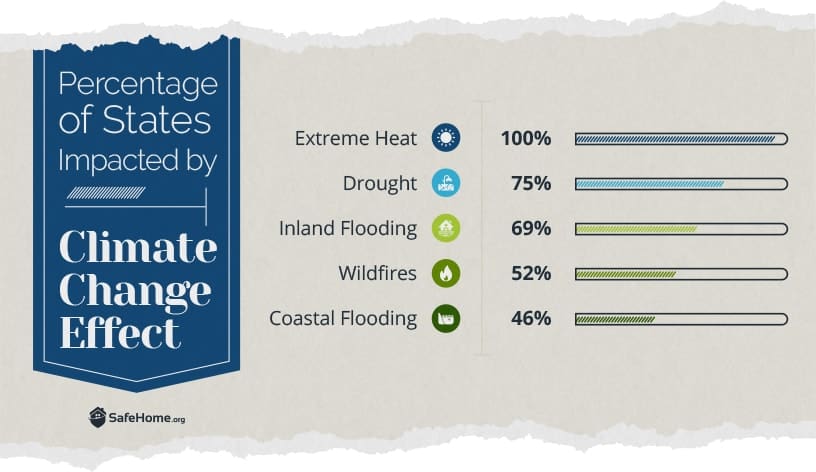
- Extreme heat, drought, inland flooding, wildfires, and coastal flooding are some of the most devastating effects of climate change.
- The effects of climate change can cost homeowners thousands of dollars in damages.
The signs are clear — if humanity is unwilling or unable to significantly curb global warming in the next decade, the consequences for life on this planet will be dire. We could witness mass extinction events, dangerous sea level changes, more extreme temperatures, and increases in catastrophic weather events.
And this isn't hypothetical; it's already happening. In 2024 alone, we witnessed the hottest year on record globally, with July marking the planet's warmest month ever recorded.1 Scientists confirm these extreme temperatures would have been virtually impossible without the influence of climate change.
Despite near unanimous scientific consensus that the dramatic increase in global temperatures over the past century has been driven by human activity, limiting the causes of climate changes remains a contentious political issue — particularly here in the U.S.
According to a 2024 Yale Climate Opinion Maps study, 72 percent of American adults believe global warming is happening, though only 59 percent attribute it primarily to human activities.2
Political divisions remain stark on this issue. According to Pew Research data from 2023, approximately 78 percent of Democrats view climate change as a major threat to the country's well-being, compared to just 23 percent of Republicans who share that view.3
But we’ve already seen the widespread effects of climate change right here in the U.S. — wildfires, stronger hurricanes and more frequent flooding, just to name a few. In such a large and environmentally diverse landmass as the United States, the effects of climate change vary considerably across the country, with some regions of the country likely to experience far worse impacts from global warming than others.
To quantify which states are likely to have it the best (and worst) over the next several decades, we examined data published by Climate Central, a group of scientists and researchers focused on documenting the effects of climate change.
Our research indicated that while every state would be impacted by rising temperatures, there are a handful of unlucky states that by virtue of their geographic placement will be especially threatened by climate change. To see the full methodology used to create our Climate Change Risk Index, jump to the bottom of the page. We have excluded Alaska and Hawaii from the analysis for lack of comparable data.
Climate Change Risk Index
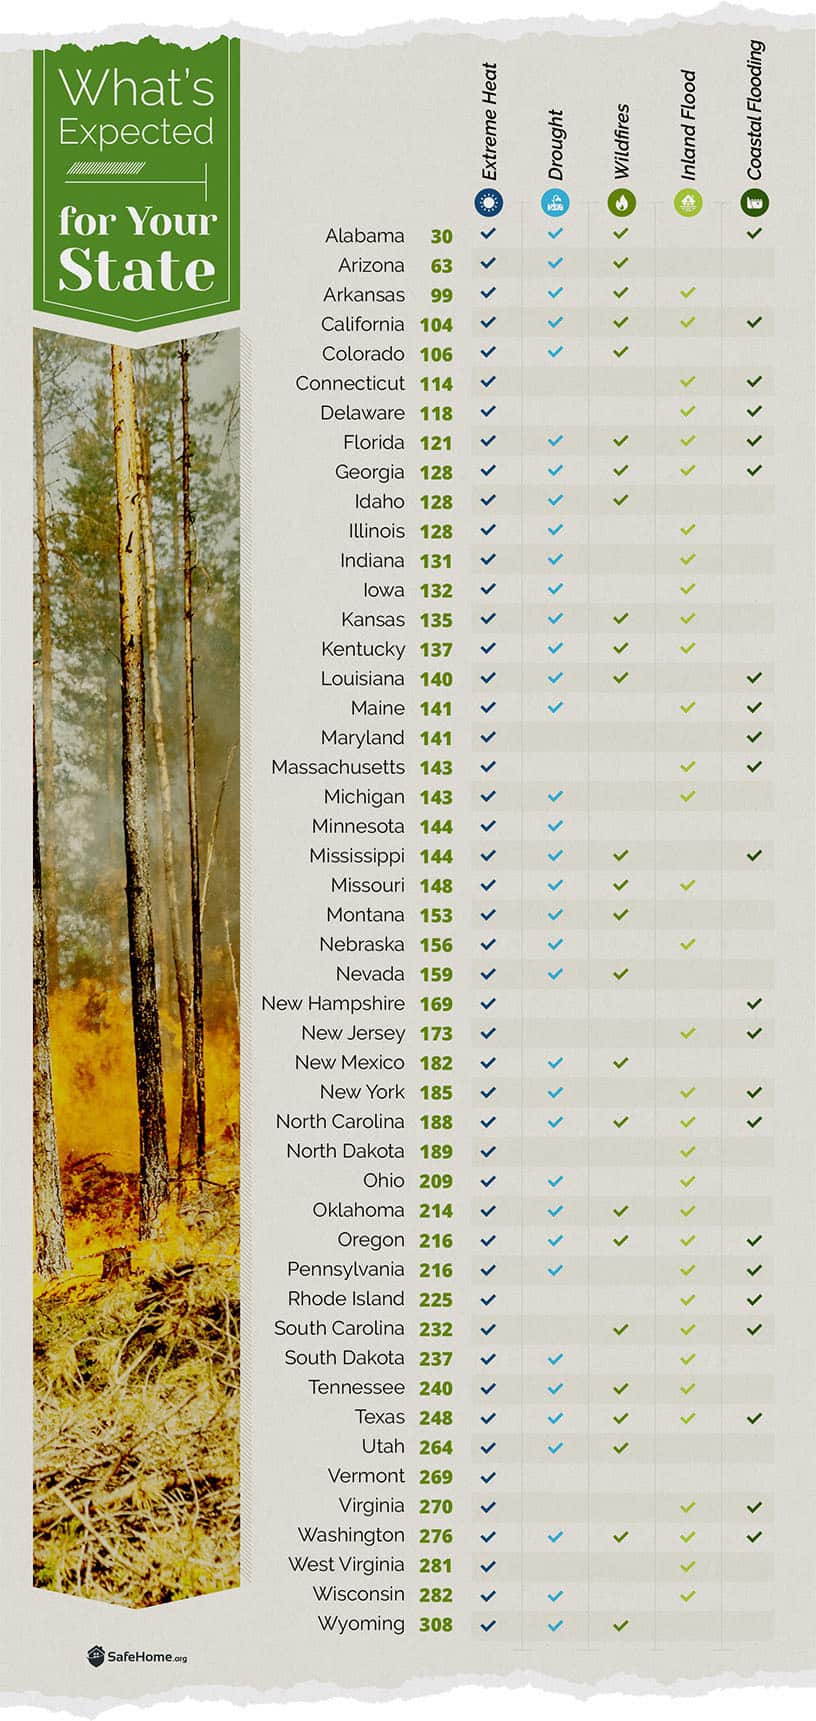
Climate change brings five major threats: extreme heat, drought, wildfires, coastal flooding, and inland flooding. Each problem feeds into the others, which can cause compounding damage. For instance, droughts can weaken foundation soil. Then, when heavy rains finally come, that parched ground can't absorb water fast enough, leading to flash floods. Those flash floods cause more damage to weakened foundations.
To calculate our Climate Change Risk Index, we compared data to determine things like how many people are at risk of dangerously high temperatures, wildfires or flooding and how climate change will extend periods like mosquito season or high wildfire risk days. Each state was ranked in each category from best to worst, and those figures were added together to create a total in which higher numbers equate to greater risk from climate change.
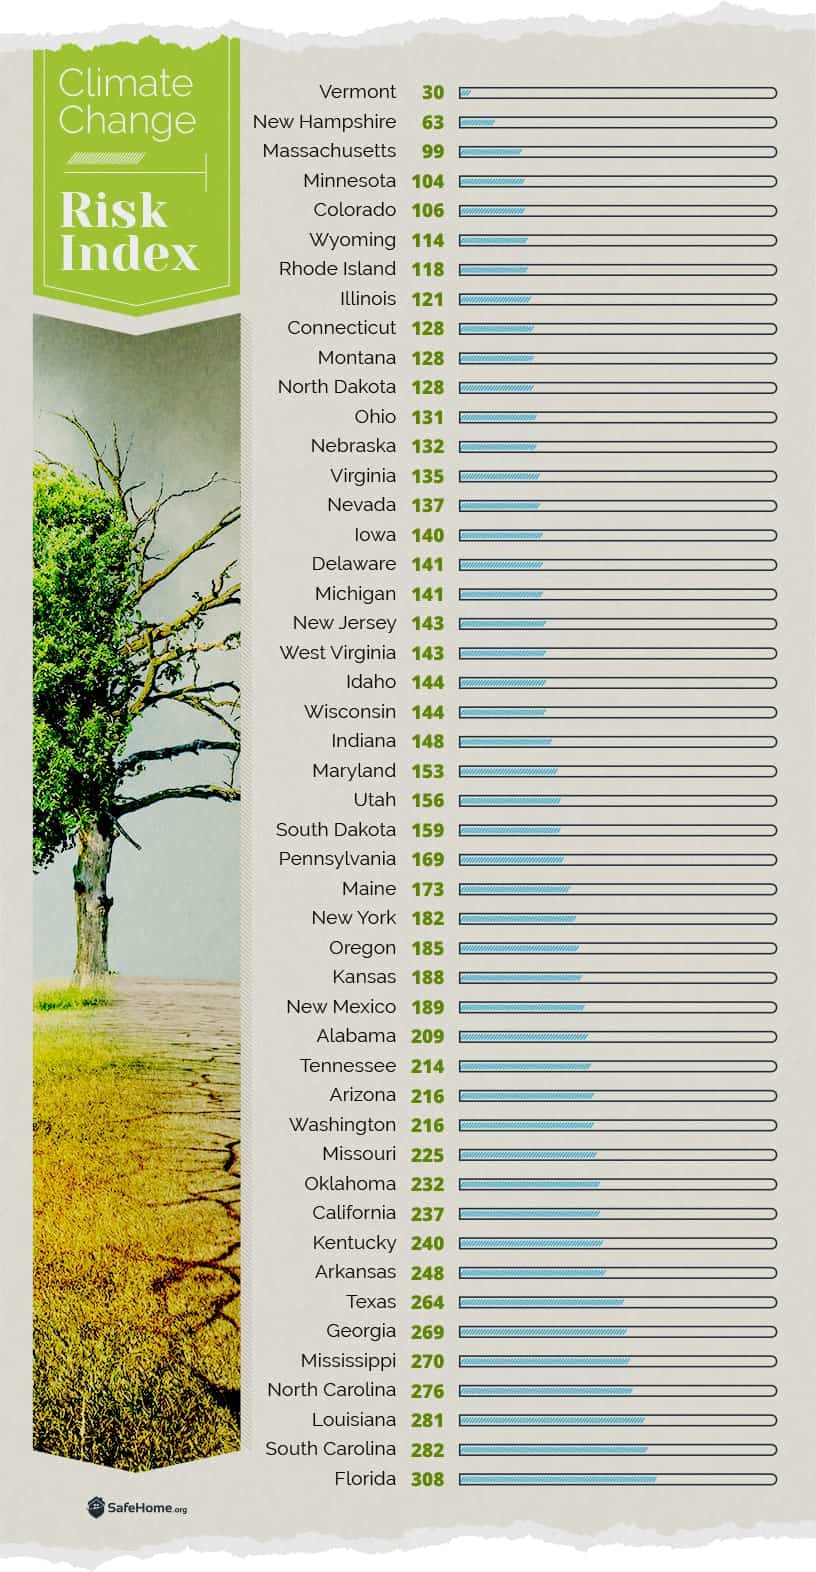
Nine of the 10 states that are likely to experience the worst impacts of climate change are in the South, and most of those are coastal states. California, a West Coast state, takes the No. 10 spot. Only two of the Southern states in the top 10, Arkansas and Kentucky, are landlocked.
On the other end of the spectrum, the Northeast dominates the list of states where climate change impact is likely to be less severe, including No. 1 Vermont, with neighboring New Hampshire in a distant second place. The Northeast is home to the only three states with Climate Change Risk Index scores lower than 100 (Vermont, New Hampshire, and Massachusetts).
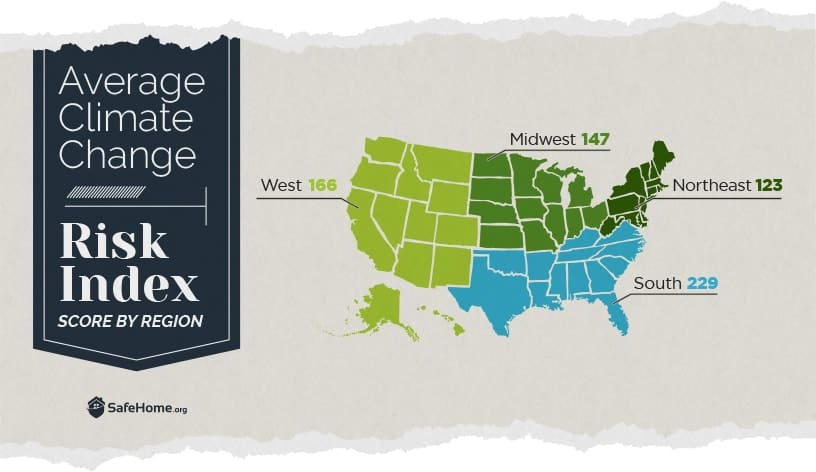
Regionally, the highest average score is in the South, where the average state has a Climate Change Risk Index score of 229, far higher than the overall U.S. average of about 174. In fact, no other region has an average score over that, though the West is close.
Every state we analyzed faces rising temperatures, but the impacts go beyond just hotter summers. We're talking about extended mosquito seasons raising disease risks, more days with dangerous air quality, and heat waves that can strain your home's cooling systems. Vermont stands alone as the only state where extreme heat is the sole major climate threat. Meanwhile, seven states face the full spectrum of climate risks.
Did You Know? Medical alert systems can be a life saving device for seniors during times of extreme heat. If you or a loved one are considering a medical alert system as a means to protect against very hot weather, you can read our guide on how to choose a medical alert system.
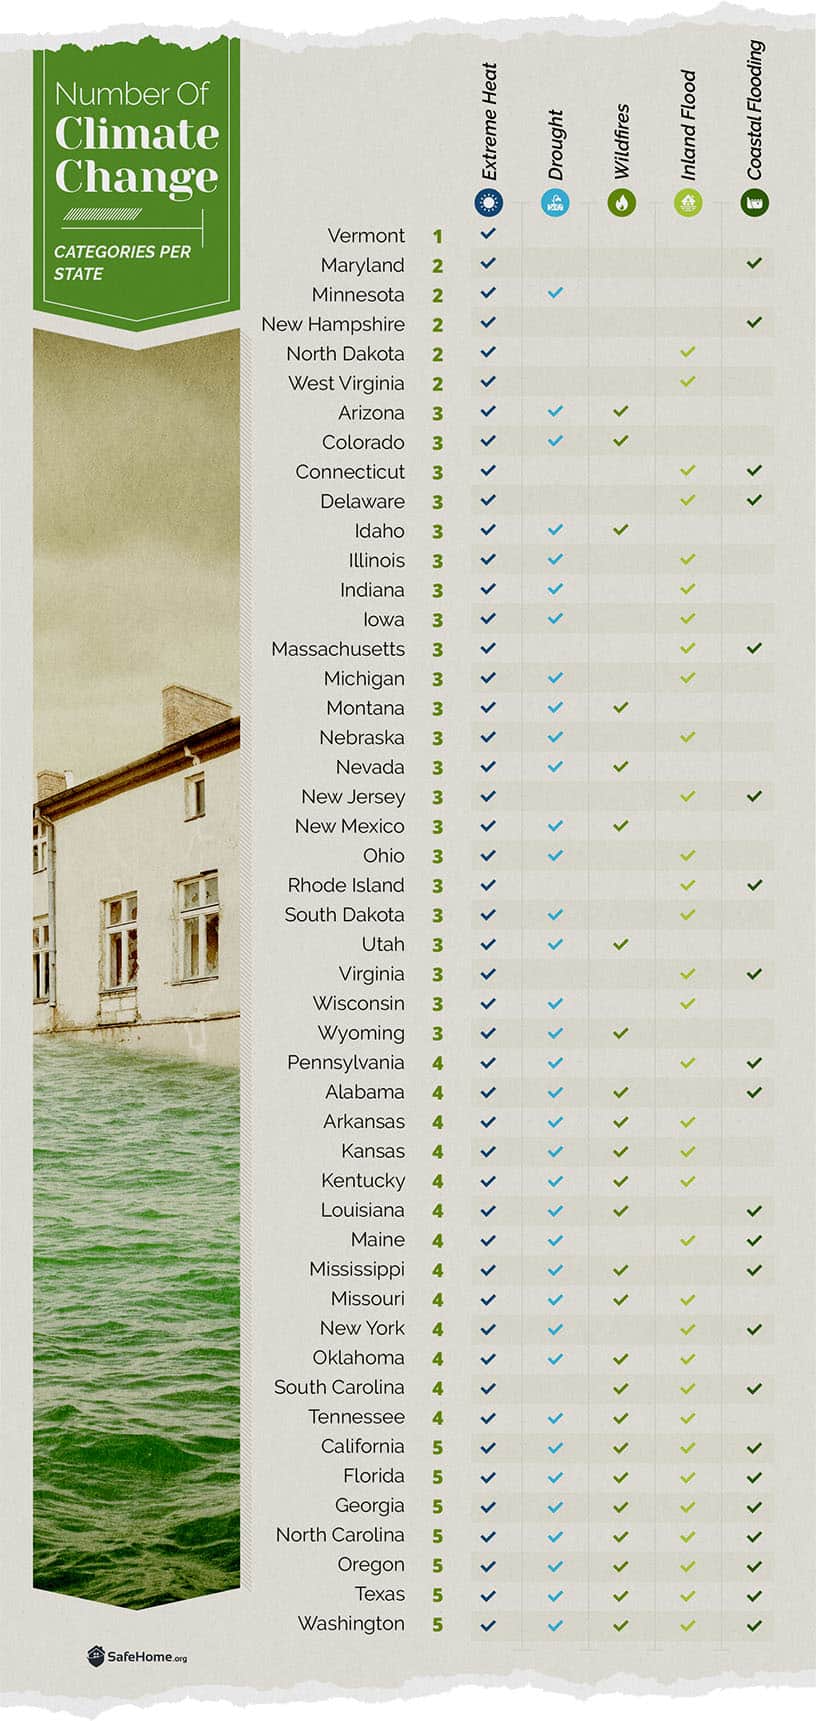
California, Florida, Georgia, North Carolina, Oregon, Texas and Washington are expected to experience all five major climate change categories over the next few decades. Not surprisingly, all of those states also have Climate Change Risk Index scores higher than the overall U.S. average.
Extreme heat will impact every state, with drought the second-most common climate change impact — 3 in 4 states are expected to see their drought risk rise. Coastal flooding is the least common climate change impact among all five, but only two states among those with the 10 highest risk scores have no coastal flooding risk.
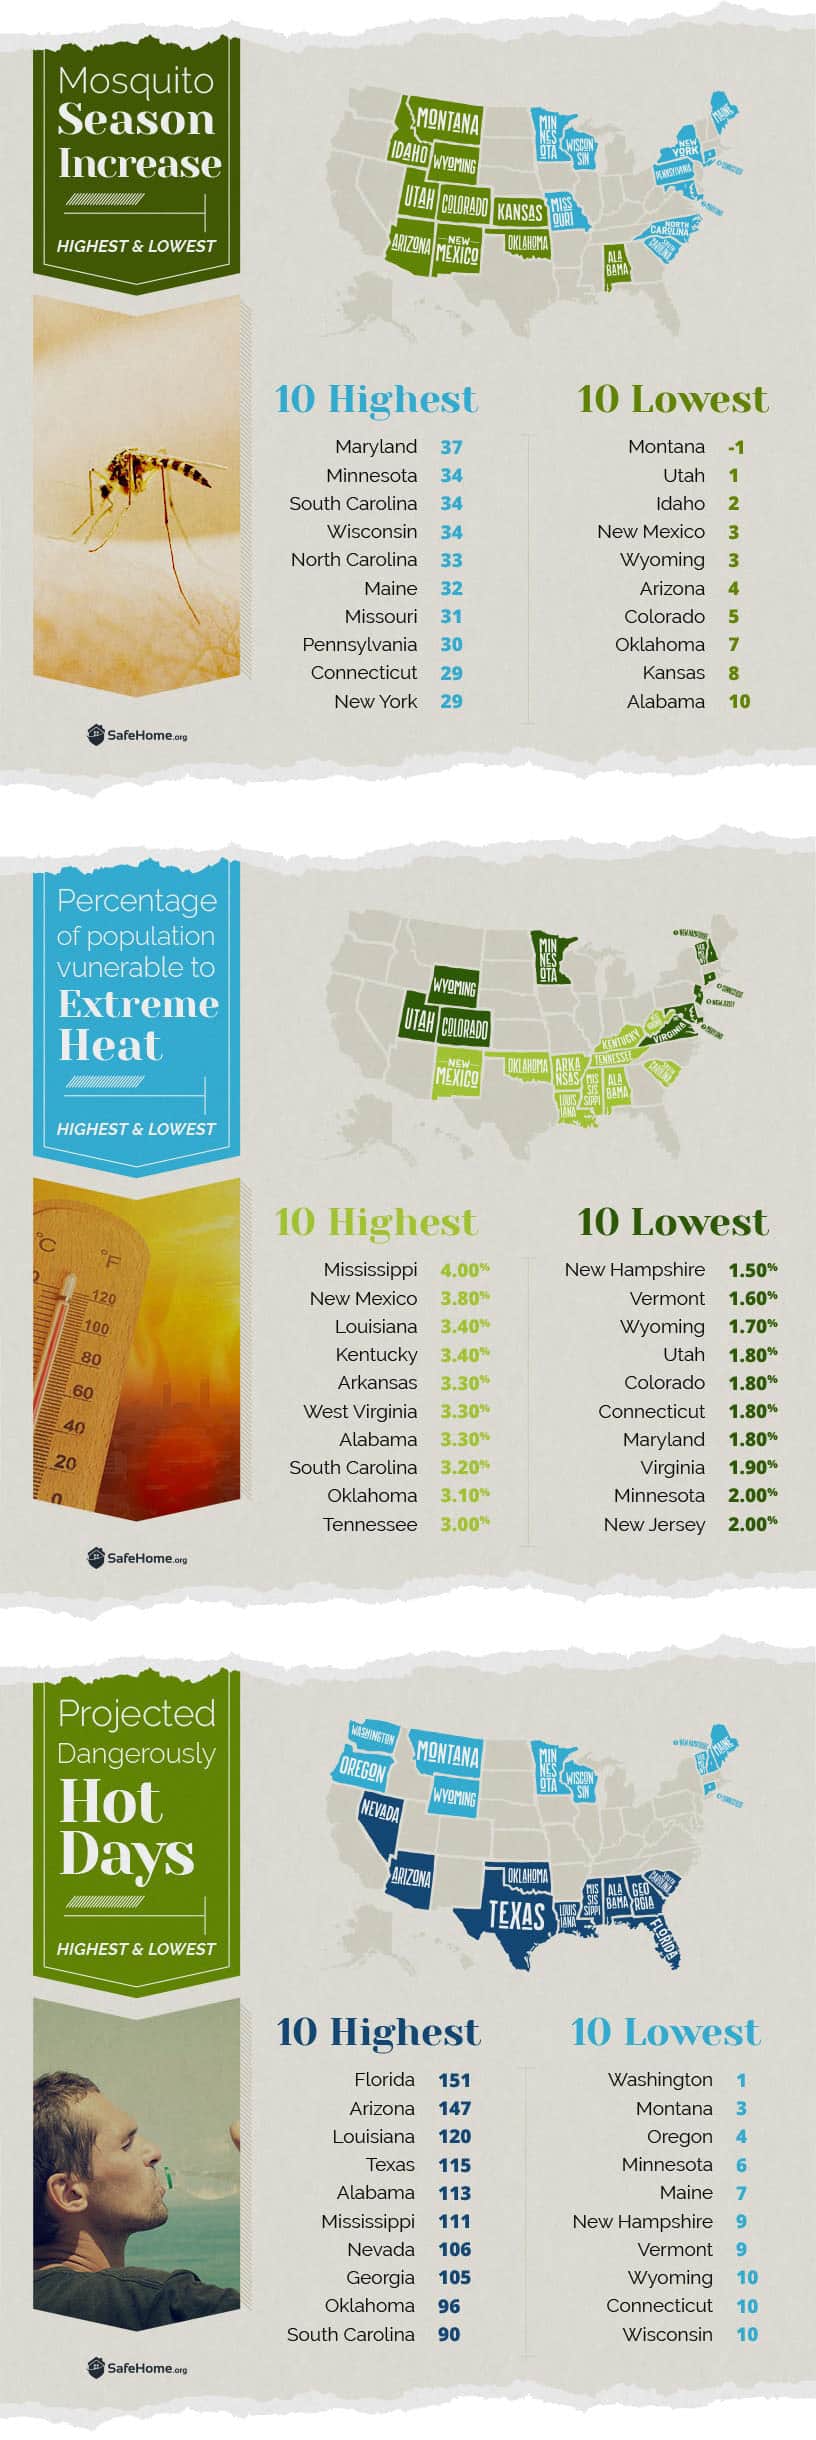
Extreme Heat
Extreme heat isn't just uncomfortable — it's the deadliest weather-related hazard in the United States. It kills more people annually than hurricanes, tornadoes, and floods combined. According to the CDC, extreme heat now causes over 1,220 deaths per year in the U.S., with that number expected to rise significantly.4
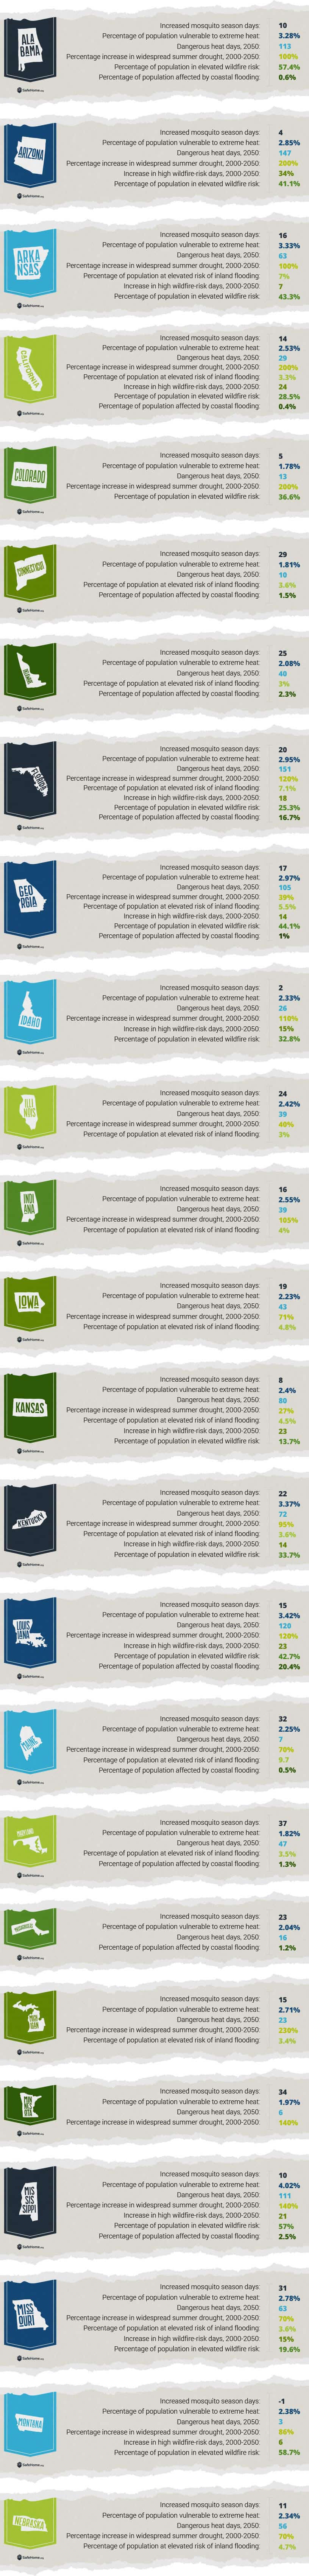
Our analysis in this area included the percentage of people vulnerable to extreme heat, the increase in mosquito season days between the 1980s and today and the projected number of dangerously hot days (days where the heat index is higher than 105 degrees) by 2050.
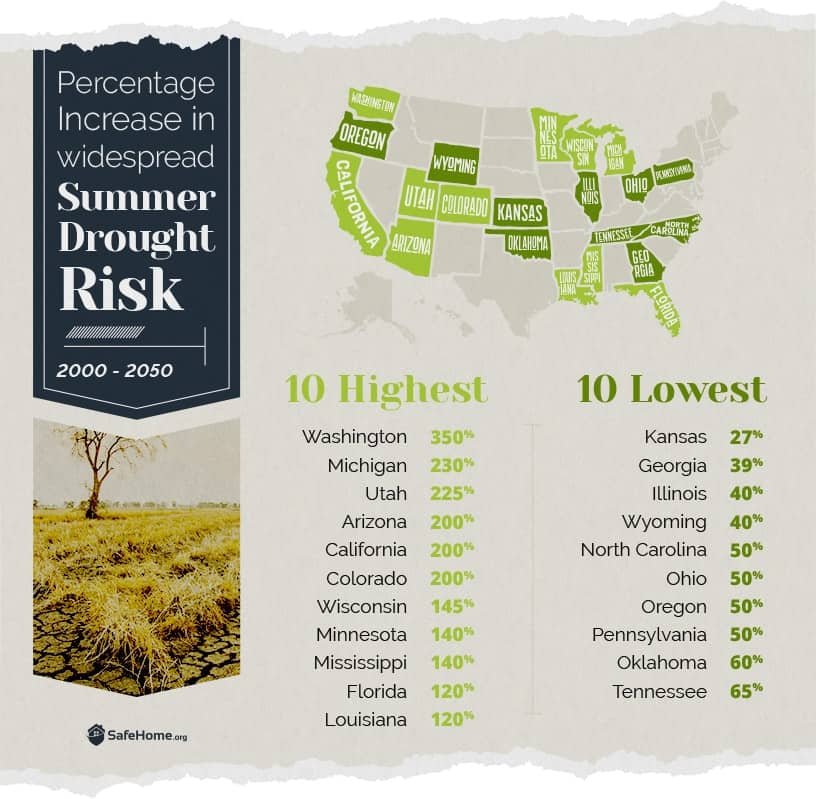
Drought
Elevated drought risk is the second most common projected climate change impact, expected to impact 75% of the states we analyzed. Because available data on drought risk is a bit sparse, and several states aren’t likely to see their drought risk rise tremendously, we included only one factor in ranking states for drought risk — the projected percentage increase in the severity of widespread summer drought. In several states, this risk is expected to explode through 2050, while every state impacted by drought is expected to see some increase in this rate.
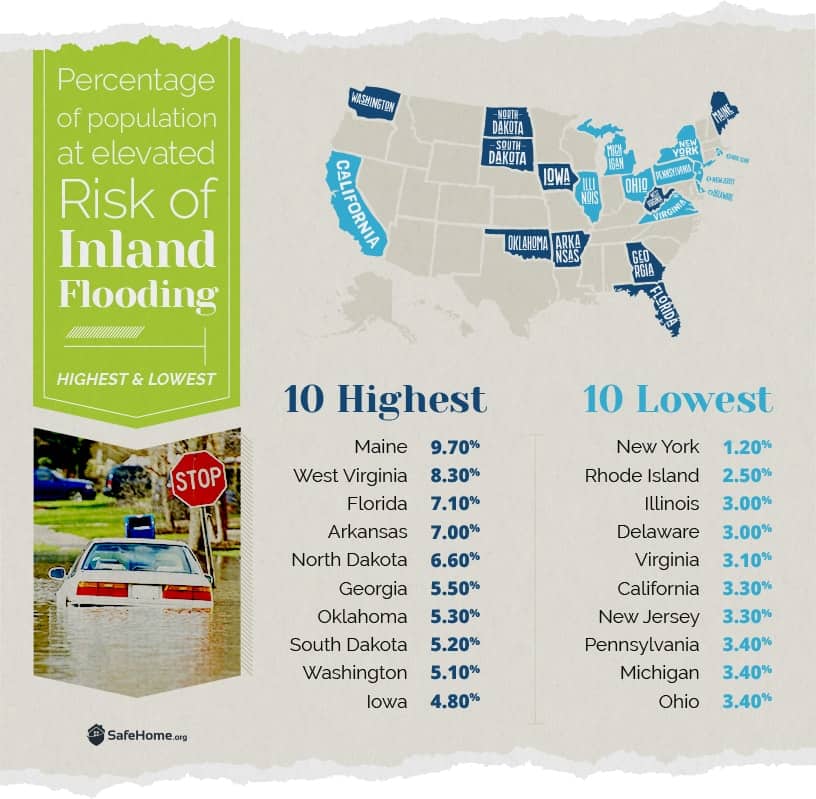
Inland Flooding
Inland flooding is projected to impact 33 of the 48 states we examined, making it the third most common climate change impact. In this area, we included one factor to rank how much inland flooding is expected to affect the state — the percentage of a state’s population at high risk of inland flooding, meaning those living in the federal government-designated 100-year floodplain.
Many homeowners don't realize that you don't need to live near a coast or river to face flood risk. Flash flooding from overwhelmed storm drains can turn your street into a river in minutes. The financial hit can be devastating — FEMA reports that just one inch of water in your home can cause $25,000 in damage.5
Did You Know? Many home security systems provide environmental sensors to ensure your home isn't damaged during times of inclement weather. You can learn more about these various environmental sensors in our guide to choosing a home security system.
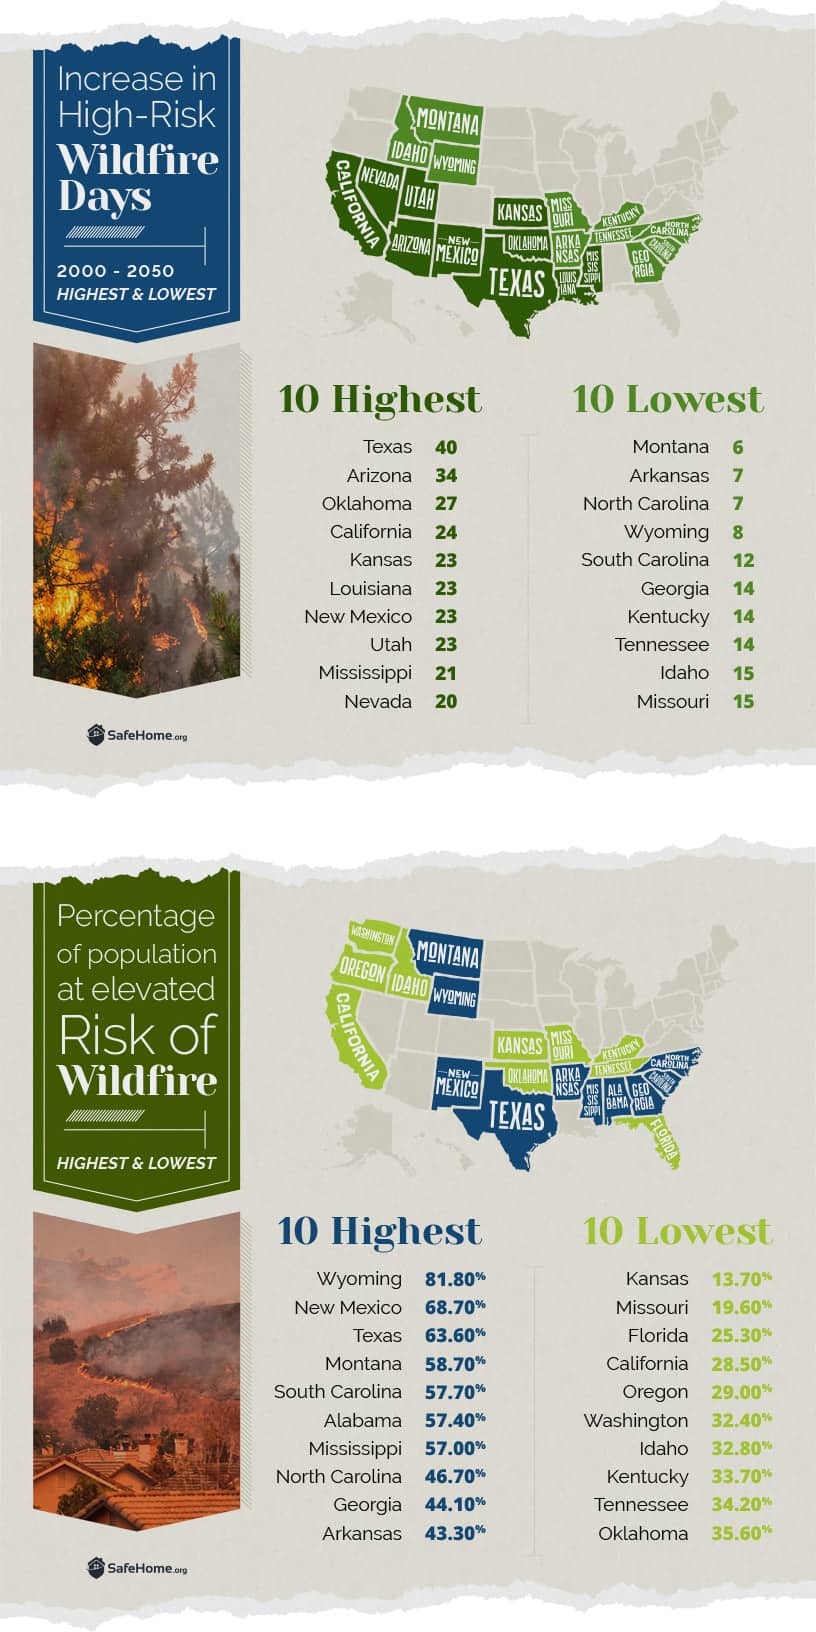
Wildfires
Just over half of the 48 states that were part of our analysis are expected to see impacts of climate change related to wildfires. In this area, we included two factors as part of our ranking — the increase in days with high wildfire potential through 2050 and the percentage of the population who currently live in an area with an elevated wildfire risk. These risks can cause serious damage with wildfires causing the destruction of 4,552 structures in 2024.6
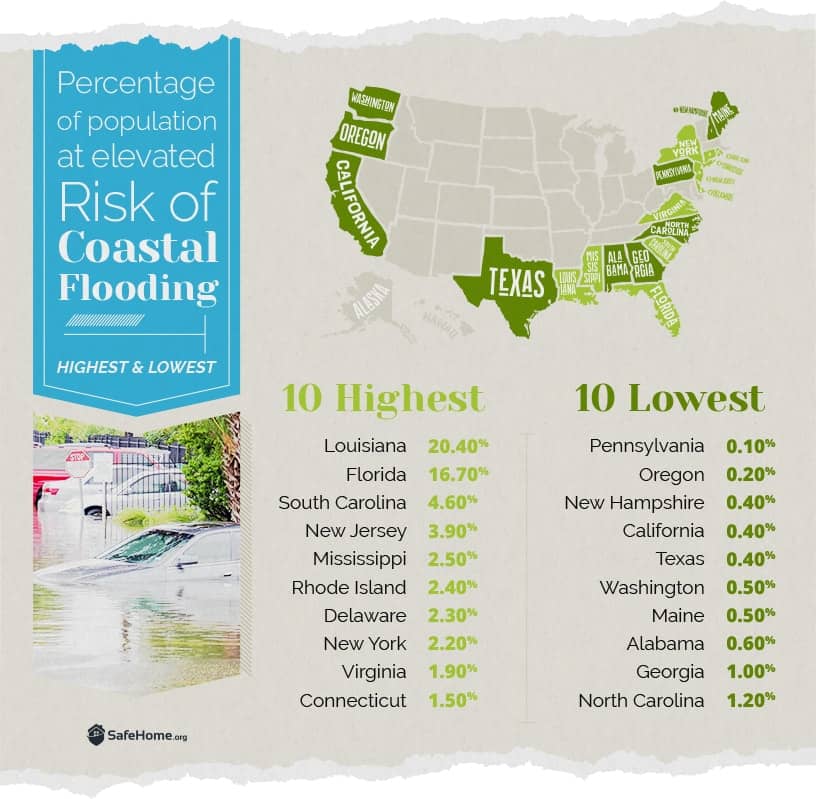
Coastal Flooding
Twenty-two states are expected to see serious impacts of coastal flooding related to climate change. In two states, upwards of 15% of the population is at an elevated risk of coastal flooding. This is the only factor we considered when examining coastal flooding risk, though many other factors exist; at-risk population is one of the only factors for which apples-to-apples comparisons can be made. The percentage of people at risk of coastal flooding represents those living in the 100-year coastal floodplain.
What About Your State?
Want to know what climate risks are heading your way? Every state faces unique challenges, from Arizona's increasing number of days above 110 degrees Fahrenheit to Maine's shift from snow to rain causing more ice storms.
Understanding your state's specific risks helps you prepare your home and protect your investment. Check your state's profile to see which climate impacts you should be planning for — because the best time to prepare is before disaster strikes:
Conclusion
Look, nobody wants to think about climate disasters hitting their home, but these changes are already affecting property values, insurance rates, and quality of life across America. The good news? You're not powerless. While we can't stop climate change overnight, we can absolutely prepare our homes and families for what's coming.
Methodology
All of the data used in our analysis came from the excellent work of Climate Central and a site it maintains, States at Risk, which is a clearinghouse of data and analysis related to the impacts of climate change on the states. We excluded Alaska and Hawaii from our analysis because not enough data was available for either one to draw fair comparisons.
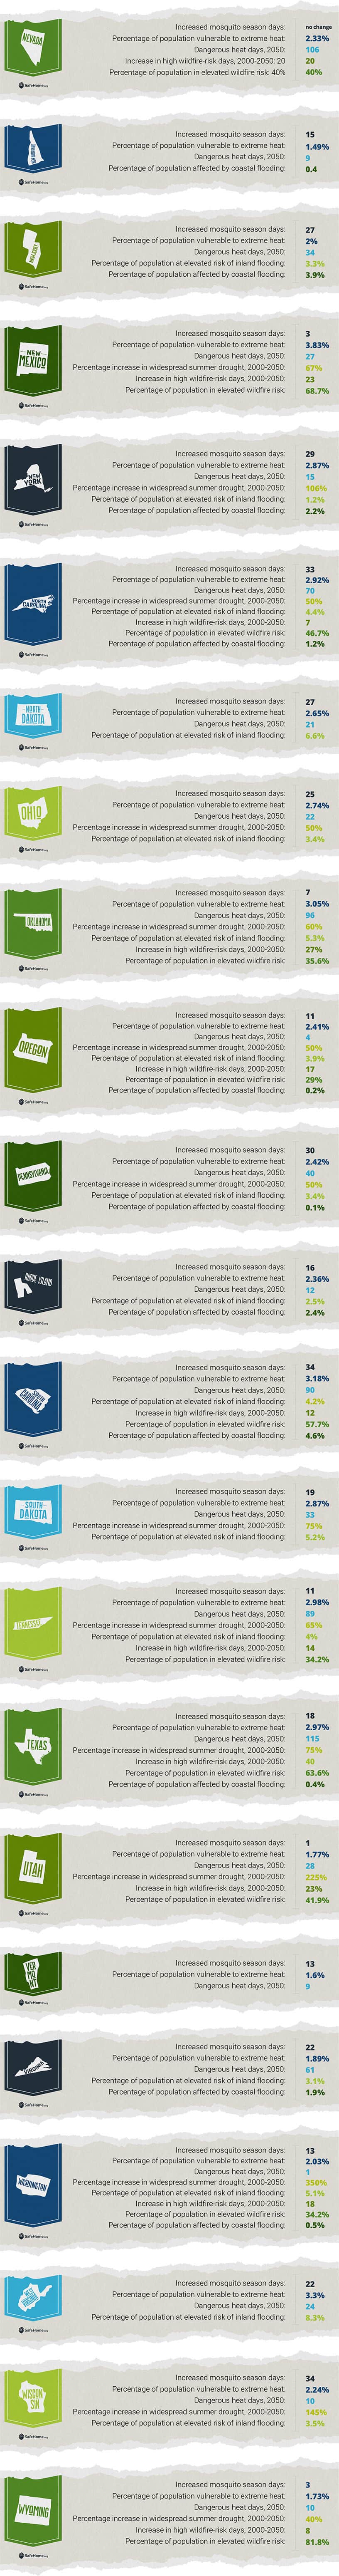
The site lists dozens of impacts for states and, often, multiple cities within the states, but the factors we included in our Climate Change Risk Index were:
- Increased mosquito season days, 1980s to today
- Dangerously hot days by 2050 (days with heat index of at least 105 degrees) in state or largest city
- Percentage of people vulnerable to extreme heat
- Increase in severity of widespread summer drought, 2000-2050
- Percentage of people currently affected by inland flooding (percentage living in 100-year floodplain)
- Increase in days with high wildfire potential, 2000-2050
- Percentage of population at elevated wildfire risk
- Percentage of people currently affected by coastal flooding (percentage living in 100-year coastal floodplain)
The data for each state was ranked from best to worst, and each state’s rank in all the categories were added together to create the overall ranking in which lower scores equate to lower risk from climate change.
Fair Use Statement
The information and images on this page are free for noncommercial uses. Please reference this page with a link to the URL at the top if you choose to share it.
Citations:
- National Aeronautics and Space Administration. (2025). Temperatures Rising: NASA Confirms 2024 Warmest Year on Record.
https://www.nasa.gov/news-release/temperatures-rising-nasa-confirms-2024-warmest-year-on-record/ - Yale Program On Climate Change Communication. (2025). Yale Climate Opinion Maps 2024.
https://climatecommunication.yale.edu/visualizations-data/ycom-us/ - Pew Research. (2023). What the data says about Americans’ views of climate change.
https://www.pewresearch.org/short-reads/2023/08/09/what-the-data-says-about-americans-views-of-climate-change/ - National Oceanic and Atmospheric Administration. (2024). Extreme heat: A media resource guide.
https://www.noaa.gov/media-advisory/extreme-heat-media-resource-guide - FEMA | National Flood Insurance Program. (2023). Understanding the Fundamentals: The Real Cost of Flooding.
https://agents.floodsmart.gov/articles/understanding-fundamentals-real-cost-flooding - National Interagency Fire Center. (2025). Statistics.
https://www.nifc.gov/fire-information/statistics